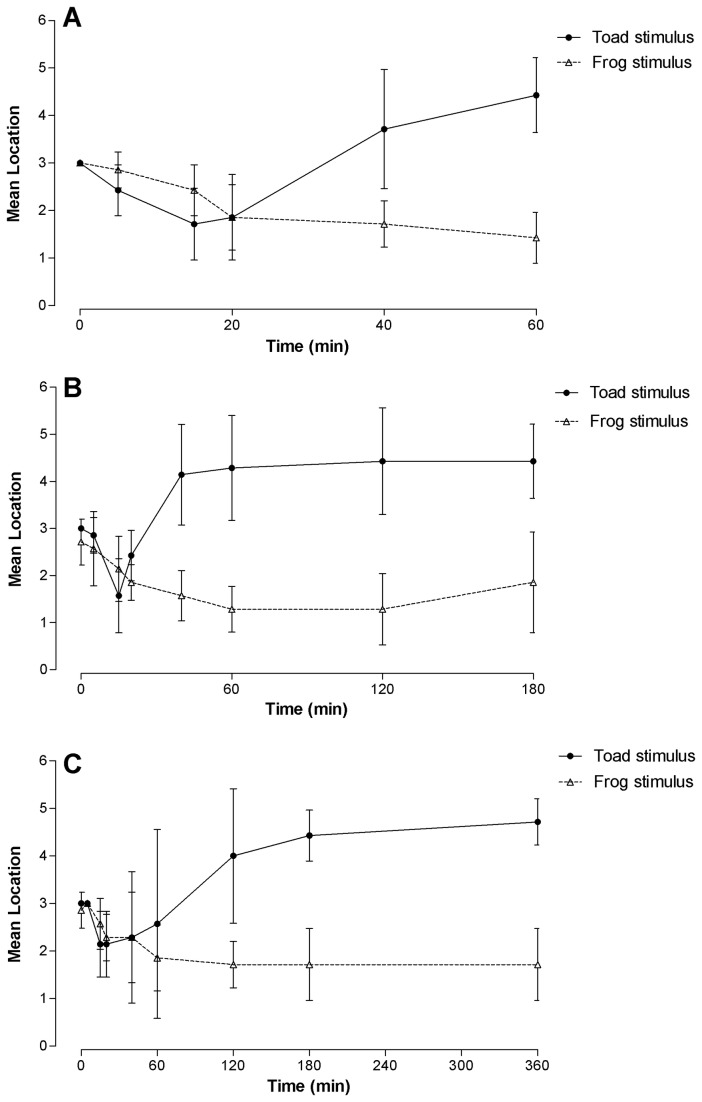
Figure 3. Mean (+ S.E.) locations of the Fijian ground frogs during exposure to a cane toad or another frog.
Location 1 was closest to the test compartment and location 6 was furthest away from the test compartment. The location of the frog was recorded at 5, 15, 20, 40 and 60 min after the test began (Fig. 3A, frogs sampled up to 60 min) or 5, 20, 40, 60, 120, 180 (Fig. 3B, frogs sampled up to 180 min) or 5, 20, 40, 60, 120, 180, 240 and 360 min (Fig. 3C, frogs sampled up to 360 min). Sample sizes at each time point were n = 7.

