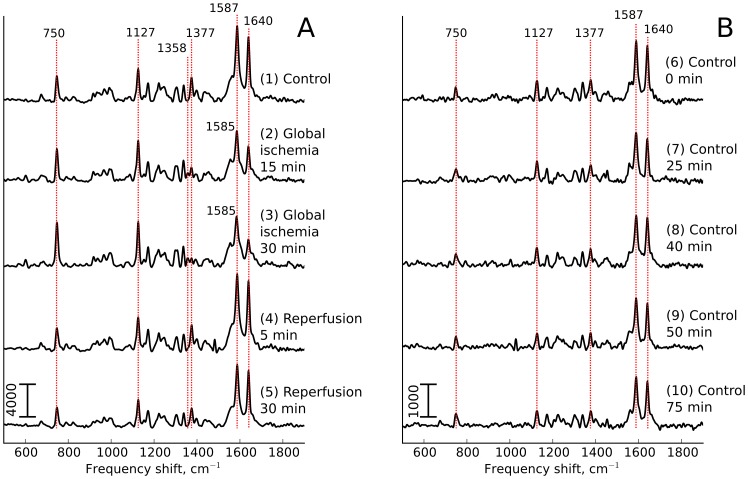
Figure 4. Experiment on global ischemia.
(A): Raman spectra of the isolated heart under global stop-flow ischemia. (B) Raman spectra of the control heart continuously perfused during the time interval equaled to the duration of global ischemia experiment. Registration time points in control experiment correspond to the registration time points in global ischemia experiment.

