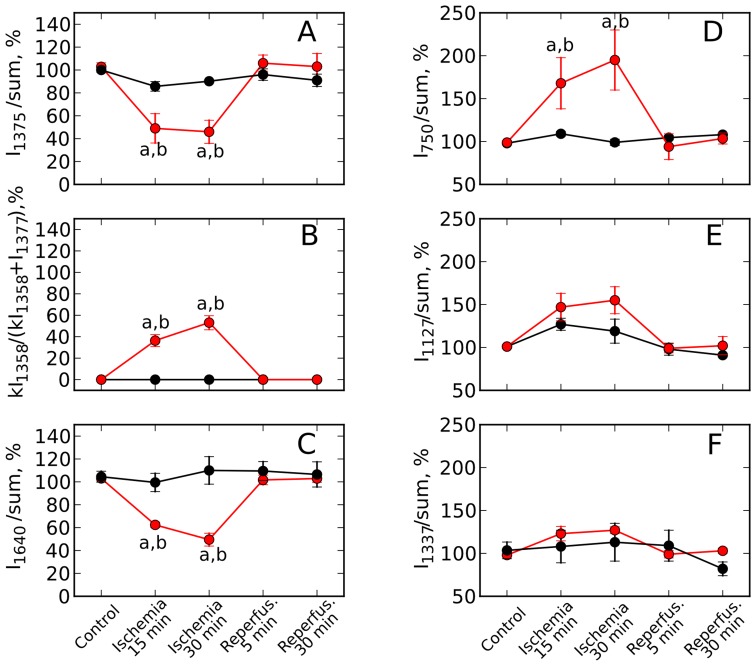
Figure 5. Effect of global ischemia on the amount of reduced cytochromes c, c1, b and oMb.
Effect of global stop-flow ischemia on the normalized intensity of oMb peaks at 1375 and 1640 cm−1 (A and C), on the relative amount of dMb (B) and on the normalized intensities of peaks corresponding to reduced cytochromes c, c1 and b at 750 and 1127 cm−1 (D and E), and to cytochromes b at 1337 cm−1 (F). Red line and markers correspond to the data of global ischemia experiments, black line and markers — to the data of control experiments. Normalization of peaks was done to the sum of the whole spectrum intensities. Values are mean SE (n = 3). Nonparametric Kruskal-Wallis test with post Dunns multiple comparison test gives
  between results for 0 min and ischemia (15 and 30 min) (a) and for 15 and 30 min of ischemia and corresponding time in the control experiment (b).

