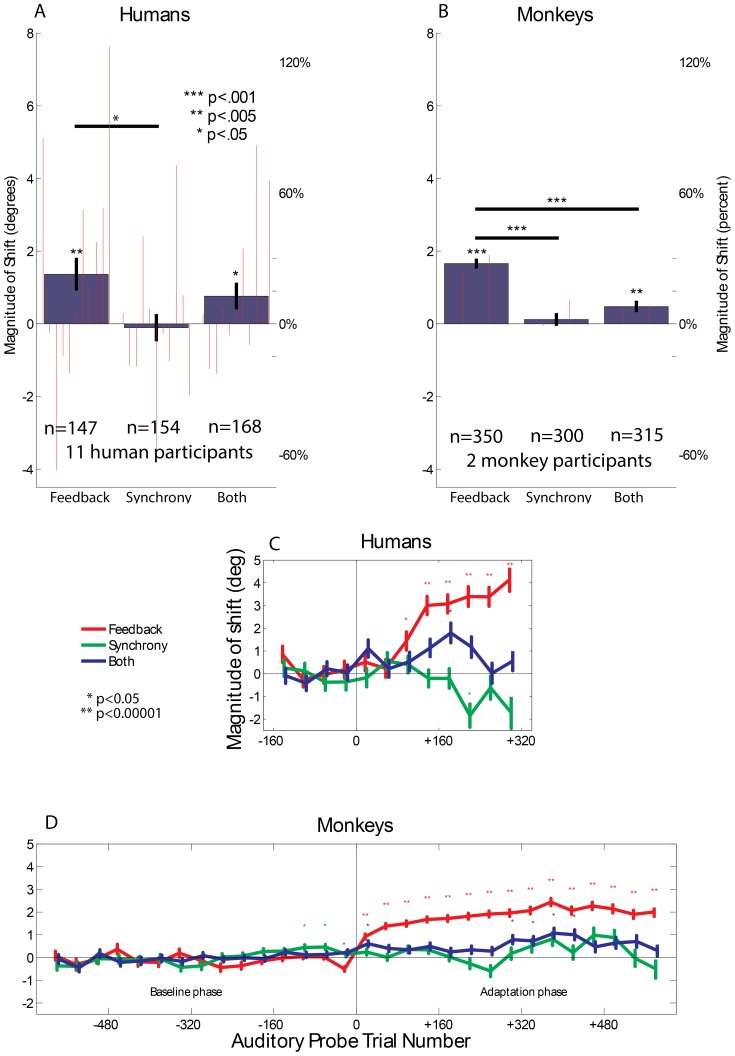
Figure 2. Robust induced shifts in Feedback condition.
The mean change +/− SE in saccade endpoints on auditory probe trials during the adaptation phase compared to the baseline phase for humans (A) and monkeys (B). The data is normalized such that the direction of the displaced visual stimulus is always considered positive. Small red bars represent individual subject totals, with the human subjects ordered by their performance on the baseline trials (best auditory saccade precision on the left) N values correspond to speaker positions*sessions (see Materials and Methods). (C, D) The time course of the shift in behavioral performance as a function of auditory-probe trial number with respect to the beginning of the adaptation phase (mean +/− SE). For example, trials 120–160 represent the 120th–160th auditory probe trial after audiovisual trials began. Each auditory probe trial is considered a data point. The data in figure 2C–2D is jittered on the X axis for readability.

