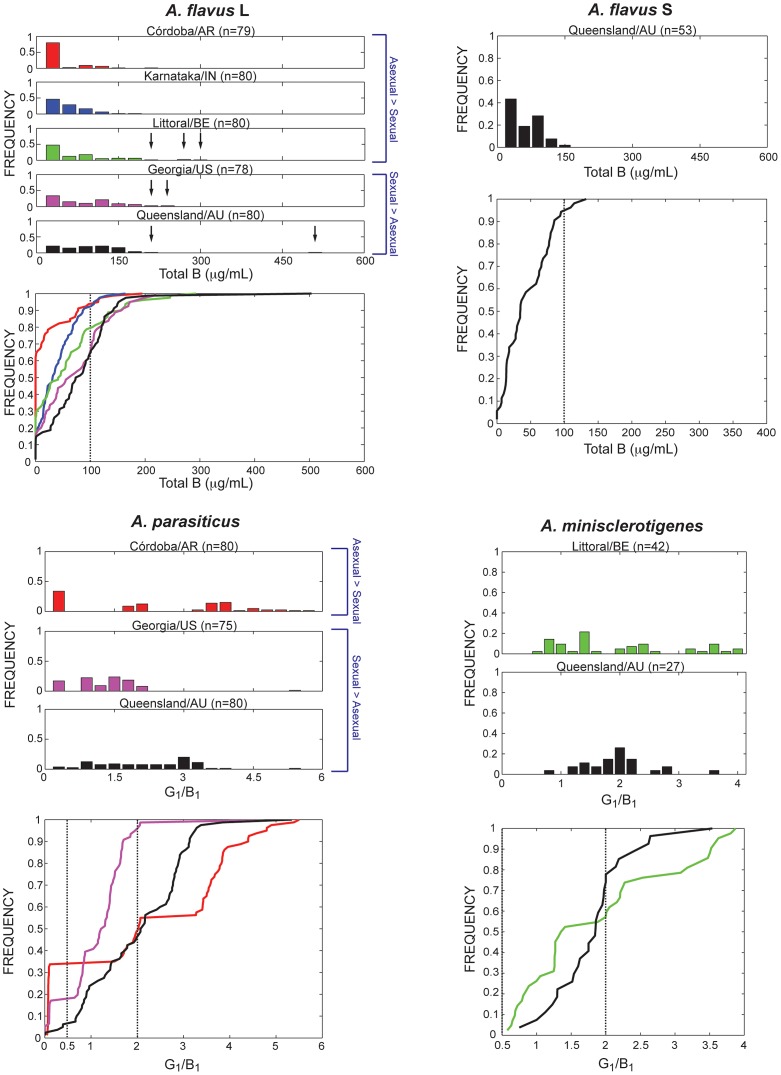
Figure 2. Aflatoxin frequency distributions (above) and plots of cumulative toxin distribution function (below) for A. flavus L and S strains, A. parasiticus and A. minisclerotigenes.
Histograms use 20 bins of equal size from 0 to 600 µg/mL for A. flavus L and S and a ratio 0 to 6 or 0 to 4 in A. parasiticus and A. minisclerotigenes, respectively. The first bin for A. flavus L and S strains ranges from 0 to 30 µg/mL and comprises 60% (48/80) of non-aflatoxigenic A. flavus L strains in Argentina, 26% (21/80) in Benin, 18% (14/80) in India, 15% (12/79) in the United States, and 14% (11/80) in Australia; 6% (3/50) of A. flavus S strains in Australia were non-aflatoxigenic in the first bin. Arrows on the A. flavus L histograms indicate isolates having concentrations of 200 µg/mL or greater. Populations are labeled as predominantly clonal (asexual>sexual) or sexual (sexual>asexual) depending on whether there was a significant skew in the clone-corrected mating-type ratio for A. flavus (Table 4) and A. parasiticus (Table 5).

