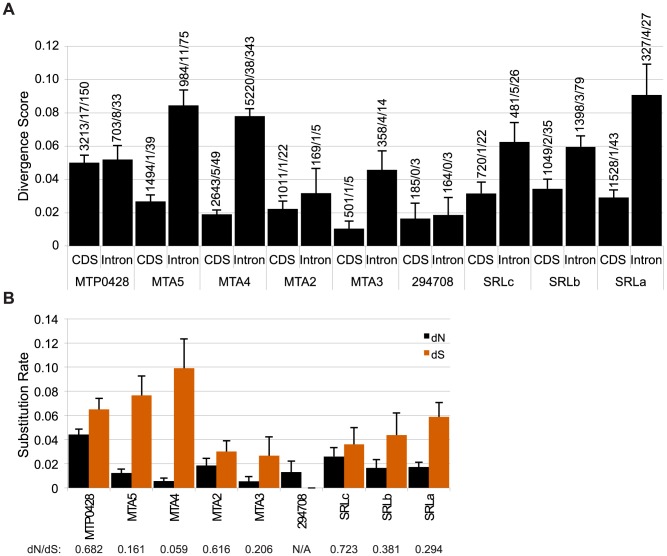
Figure 3. Divergence of autosomal and MT+ duplicated genes.
A. Bar graph of nucleotide divergence values [77] for alignments of coding (CDS) and intron sequences of MT+ genes and their autosomal progenitors as shown in Figure 2. Bars depict divergence with standard error indicated by lines. Values above each bar show total number of aligned bases/number of indels/number of substitutions for the alignment. B. Synonymous (dS) and non-synonymous (dN) substitution rates for CDS alignments described in Panel A with the standard error indicated by the line on top of each bar. dN/dS ratios are shown below each gene.

