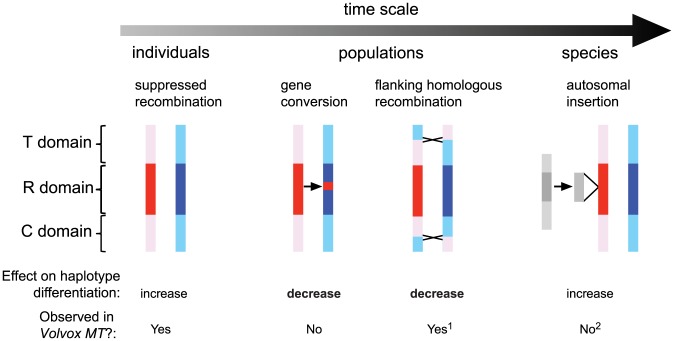
Figure 7. Genetic processes that shaped evolution of the Chlamydomonas reinhardtii mating locus.
The time scale arrow on top represents a frequency continuum for genetic processes affecting MT that are detectable within individual generations, within populations, or in the species. Models of genetic exchange show the MT haplotypes in red (MT+) and blue (MT−) with the rearranged (R) domain shaded dark and the flanking telomere-proximal (T) and centromere-proximal (C) domains shaded light. From left to right: In individuals little or no genetic exchange is observed in crosses due to suppressed recombination; In populations occasional gene conversion within the R-domain, and crossover exchange or gene conversion in the T and C domains act to homogenize genetic variation that accumulates between haplotypes; At the species-level autosomal insertions (gray shaded regions) have occurred at least three separate times in the MT+ haplotype and spread to fixation, thereby adding new mating-type-limited genes to the locus. The lower section summarizes the impact of genetic interactions in Chlamydomonas MT in terms of increasing or decreasing haplotype differentiation and whether such interactions occur in Volvox MT. Notes: 1, Suppressed recombination in Volvox MT does not appear to extend beyond the R-domain as it does in Chlamydomonas [11]. 2, Only unique autosomal sequence insertions (but not transposons or repeats) are considered in this schematic.

