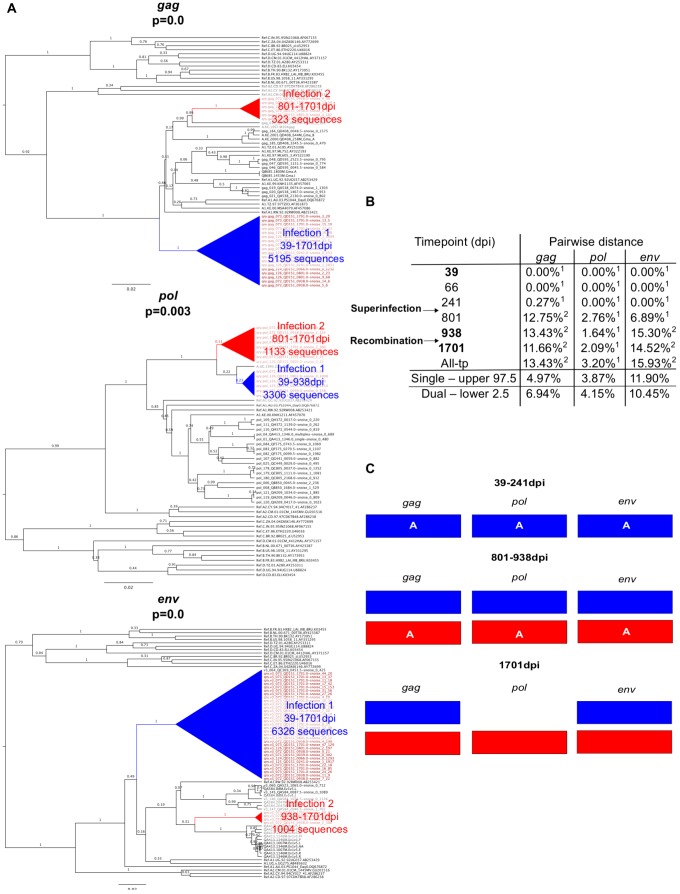
Figure 2. Superinfection case QD151.
A. Phylogenetic trees representing viral sequence from all timepoints in each genomic region analyzed. The corresponding posterior probability of monophyly is displayed. Initial variant branches are collapsed and highlighted in blue, superinfecting variant branches in red. Red branch labels mark query sequences from individual QD151 at all timepoints, black labels mark reference sequences. B. Maximum percent pairwise distance (PWD) between sequences within each timepoint listed or across all timepoints (All-tp). The 97.5% confidence limit of the distances observed among viral sequences within known singly infected individuals and the 2.5% confidence limit within simulated mixtures of sequences from two individuals are shown for comparison. Timepoints shown in bold type are the 3 samples originally screened; the rest were subsequently sequenced to specify superinfection timing. 1 PWD within 95% confidence interval observed for single infection. 2 PWD outside 95% confidence interval for single infection and within 95% confidence interval for dual infection. C. Schematic summarizing viral variants detected in each genomic region over time (initial variant depicted in blue, superinfecting variant in red). Viral subtype is indicated.

