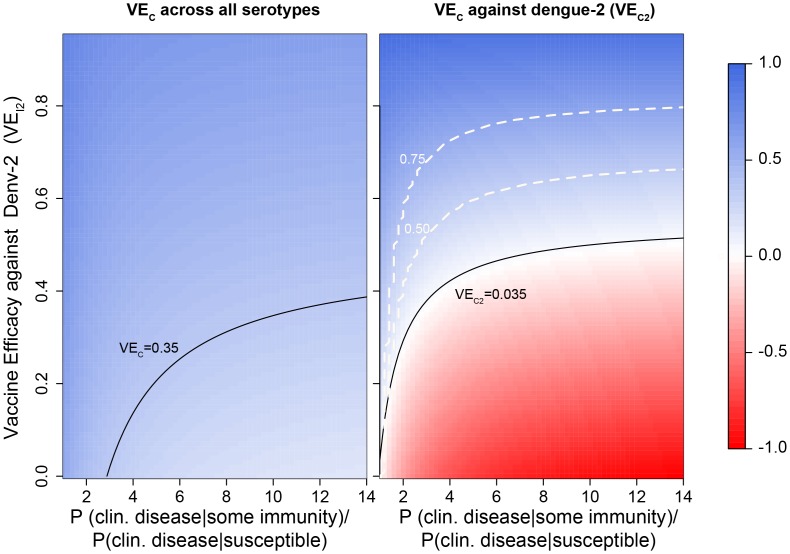
Figure 2. Output from our analytical framework showing the relationship between VEI and VEC.
For this example, we assumed the following serotype-specific efficacies against infection: VEI1 = 0.6 (i.e., VEI for DENV1 = 0.6), VEI3 = 0.8, and VEI4 = 0.9. We explored a range of VEI against dengue-2 (VEI2) (y-axis). The x-axis is the ratio of the probabilities of developing clinical disease in people with and without prior immunity, and hence reflects the extent to which prior heterologous immunity (natural or vaccine acquired) modifies the probability of clinical disease. The background color represents expected vaccine efficacy against clinically apparent infection for all serotypes (left panel) and for dengue-2 (right panel). Solid black contours indicate the clinical vaccine efficacy VEC observed in the Ratchaburi trial [1] according to the intention-to-treat analysis. Dashed white contours indicate levels of the ratio VEC2:VEI2. Thus, the 0.5 contour divides the regions where VEC2 underestimates VEI2 by a factor greater (above) or lower (below) than 0.5. In this particular simulation, VEC always underestimates VEI.

