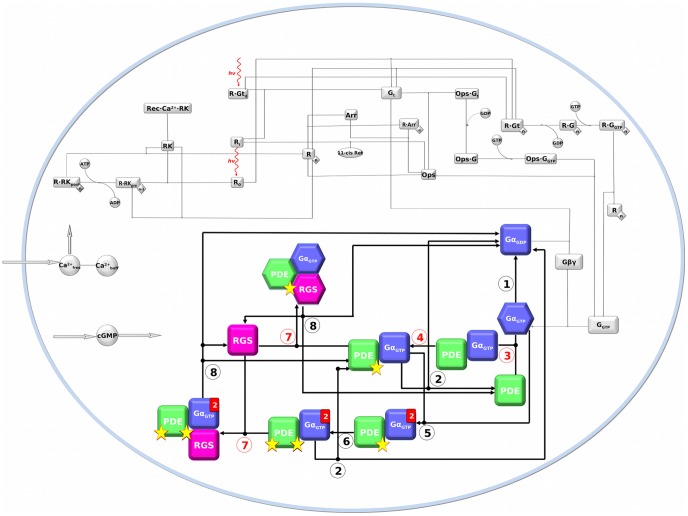
Figure 1. Network structure of the phototransduction model in a rod cell used in the present work.
The different forms depict the molecular species involved in the cascade, whereas lines or arrows indicate reversible or irreversible reactions, respectively. Those reactions whose kinetic parameters were changed in this study are numbered and listed accordingly in Table 1. In this respect, red numbers indicate those reactions that were changed to properly model the NCNB pathological conditions. The molecules involved in these reactions, i.e. GαGTP, PDE, and RGS, are blue, green, and magenta, respectively. Filled red rectangles indicate the stoichiometric quantity of the specific molecule in the heteromeric complex, when higher than one. Yellow stars indicate the number of PDE-activated catalytic subunits. Hexagons indicate the molecular species that were used in atomistic simulations.

