
Figure 3. Flash responses from wild type, GαGTP G38D+/−, and GαGTP G38D−/− rods.
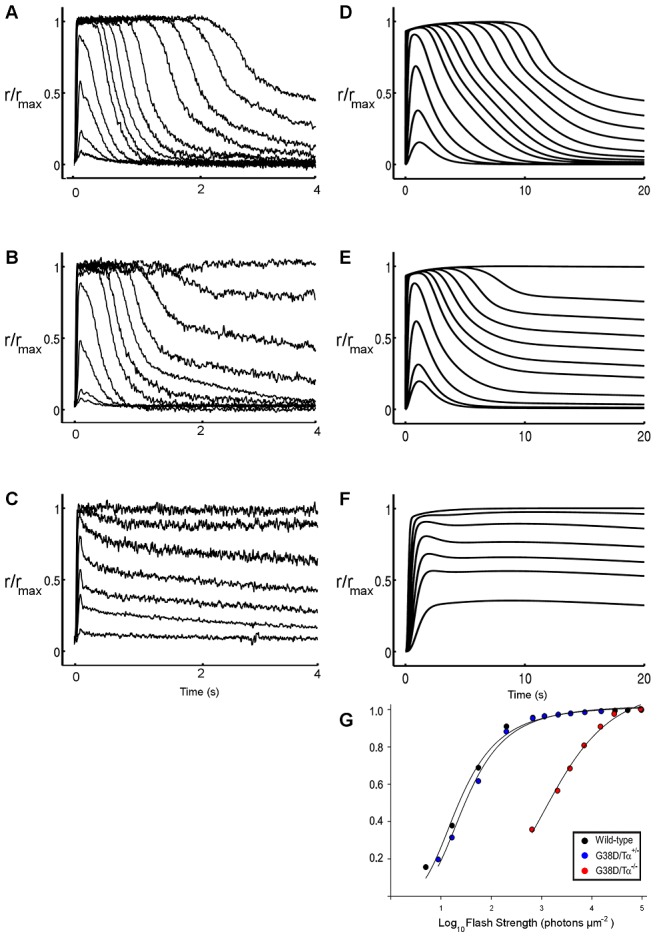
Experimental (A, B, C) versus simulated (D, E, F) responses to flashes of increasing intensities from wild type GαGTP WT+/+ (A, D), heterozygous GαGTP G38D+/− (B, E) and homozygous GαGTP G38D−/− (C, F) rods are shown. Experimental data, i.e. published in Moussaif et al. [8] and provided by Marie E. Burns, refer to mice rods exposed to flashes ranging from 5 to 97000 photons µm−2 (A and B) or from 650 to 94000 photons µm−2 (C). Simulated responses derive from the model of an amphibian rod stimulated with the same light intensities as in vitro recordings. The pathological GαGTP G38D+/− and GαGTP G38D−/− models were generated by changes in the kinetic parameters kP1, kP2 and kRGS1 as described in the text. The dissimilar species justify the time scale difference between in vitro and in silico experiments. The responses were normalized with respect to the maximum photocurrent. G. Normalized simulated light response amplitude is plotted as a function of flash strength. For comparison to in vitro data, see Figure 5B in Moussaif et al. [8]. Flash intensities are the same as in D, E and F.