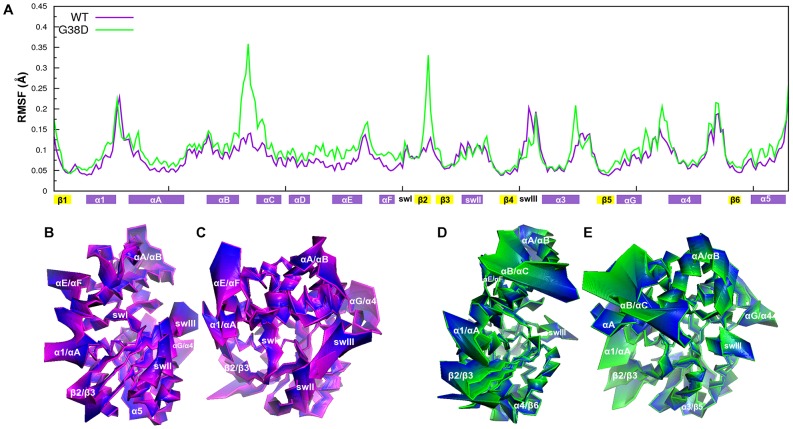
Figure 4. RMSF profiles and PCA projections.
A. The Cα-RMSF profiles from MD trajectories of GαGTP WT (violet) and GαGTP G38D (green) are shown. They refer to the 100000 frames constituting the 100 ns trajectory. The secondary structure elements are shown on the abscissa, following the Noel's nomenclature [19]. B, C, D, E. The Cα-atom projections along the linear combination of the ED analysis-derived principal components, which describe the essential subspace of the trajectories of GαGTP WT (B and C) and GαGTP G38D (D and E) are shown (see text for an explanation of ED). The number of PCs used was 111 for GαGTP WT and 74 for GαGTP G38D. Cα-atom displacements are highlighted by color ranges from violet to blue for GαGTP WT, and from green to blue for GαGTP G38D.

