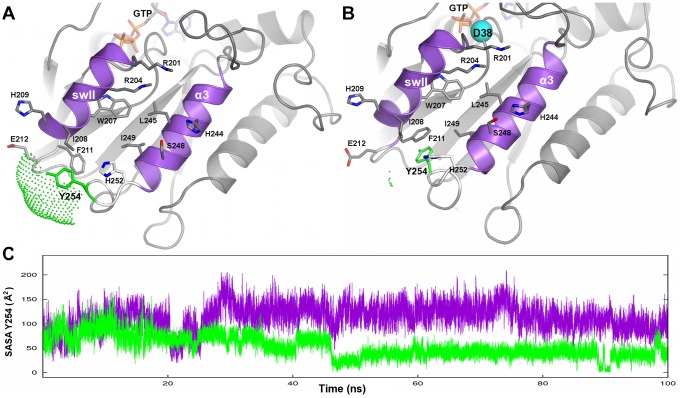
Figure 5. SASA time series.
The SASA computed on Y254 (in the α3/β5 loop) is shown. Cartoons of the GαGTP WT (A) and GαGTP G38D (B) snapshots halfway through the simulation (frame 50000th) are shown, which are zoomed on the swII/α3 cleft, the primary recognition site for PDEγ. The Gα residues directly involved in PDEγ recognition (i.e. marked by green stars in the primary sequence in Figure 2) are shown in sticks. The atom color code is grey for carbon, blue for nitrogen, and red for oxygen. The residue Y254, on which the SASA index was computed, is green. The cyan ball in B indicates the mutation site. C. The time series of the SASA index calculated on Y254 along the 100 ns trajectories of GαGTP WT (violet) and GαGTP G38D (green) are shown.

