
Table 1. Reactions that were changed in the background of the G38D mutation.
| Na | Reaction Equation | Descriptionb | O.P.c | Mind | Maxd | Effecte |
| 1 |
|
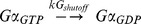
Intrinsic GαGTP GTPase activity | 0.05 | ×2 | 0 | None |
| 2 |

|
Intrinsic GαGTP-PDE GTPase activity | 0.033 | ×2 | 0 | Slowed recovery when = 0 |
| 2 |

|
Intrinsic GαGTP-PDE- GαGTP GTPase activity | 0.033 | ×2 | 0 | Slowed recovery when = 0 |
| 3 |

|
Binding of GαGTP to inactive PDE | 5.5e-2 | ×2 | ×109 | Slowed activation, lower sensitivity and recovery with changes >×106 |
| 4 |
|
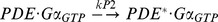
Activation of one PDE catalytic subunit | 940.7 | ×2 | ×104 | Slowed activation phase with changes >×103 |
| 5 |

|
Binding of GαGTP to GαGTP-PDE | 1.498e-9 | ×2 | ×105 | None |
| 6 |

|
Activation of the PDE tetramer | 21.09 | ×2 | ×105 | None |
| 7 |

|
Binding of RGS9 to GαGTP-PDE | 1.57e-7 | ×2 | ×15 | Slowed recovery phase |
| 7 |

|
Binding of RGS9 to GαGTP-PDE-GαGTP | 1.57e-7 | ×2 | ×15 | Slowed recovery phase |
| 8 |

|
GAP activity and disruption of the complexes | 256.07 | ×2 | ×105 | Increase in saturating phase for bright flashes with changes >102 |
| 8 |

|
GAP activity and disruption of the complexes | 256.07 | ×2 | ×105 | Increase in saturating phase for bright flashes with changes >102 |
a
Reaction number, corresponding to that in Figure 1.
b
Type of reaction.
c
Original value of the parameter governing the reaction kinetics in the mathematical model (s−1) [14].
d
Minimum and maximum reductions the considered parameters were subjected to in the present study, in order to model the mutated conditions; when “Max R” was 0, the parameter was ultimately set to zero.
e
Effect of these reductions.