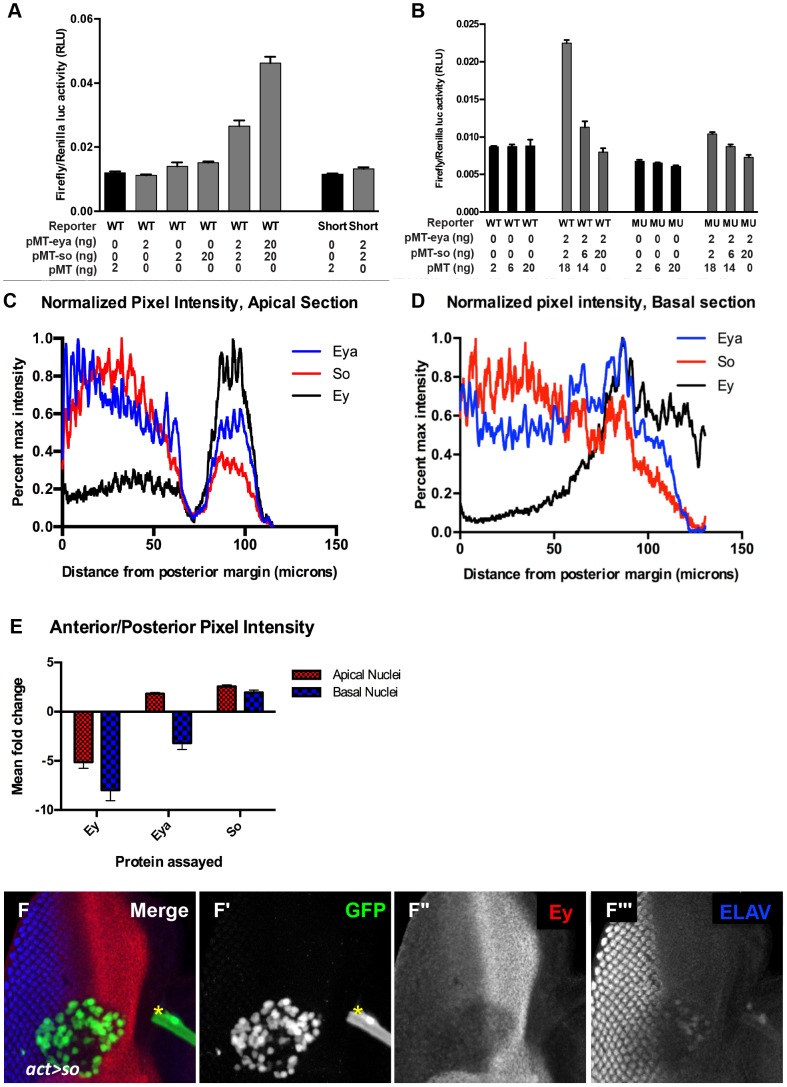
Figure 6. Excess So is sufficient to block enhancer activation in vitro.
(A,B) Luciferase assay performed in transiently transfected S2 cells, reported as a ratio between Firefly and Renilla luciferase levels. Reporter constructs as indicated: WT = ey-Luc, Short = eyshort-Luc that deletes the So binding site, MU = eymut-Luc. Controls are graphed in black; manipulations are in gray. For each condition the nanograms transfected of pMT-eya, pMT-so, or pMT empty vector are indicated. (C,D) Normalized pixel intensity plots for fluorescent immunohistochemistry to assay Eya (blue), So (red), and Ey (black) expression in a w1118 disc (see Materials and Methods). (C) Staining intensity in apical nuclei. (D) Staining intensity in basal nuclei. (E) Mean fold change for each channel was calculated (n = 5), and plotted. Error bars indicate S.E.M. (F) Flipout-Gal4 driving UAS-GFP and UAS-So expression showing GFP, Ey, and ELAV. Yellow asterisk denotes a piece of trachea that is not part of the disc. (F′–F″) individual channels from panel F. (F′) GFP marks the clone, (F″) Ey, (F′″) ELAV shows differentiating photoreceptors.

