
Figure 1. Schematic illustration of the apparent stiffness  .
.
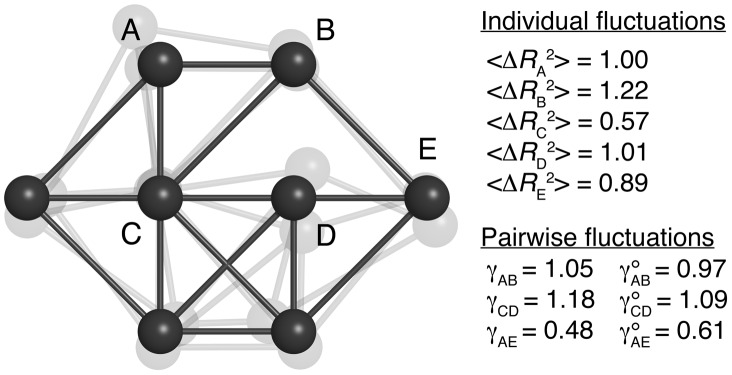
A simple model containing 8 beads connected by elastic springs was subjected to  integration steps under Gaussian noise. Selected values of
  ,
,  and
and  are given in arbitrary units. Individually, the pairs A–B and C–D would be identical, but they experience differently the influence of the other beads. As a result, the C–D pair is effectively more rigid than A–B (
 ). In both cases, the motions are somewhat correlated, as the apparent stiffness
  is larger than what is expected from the knowledge of their individual motions (
 ). Beads A and E do not interact directly but the effect of the network on their relative motions is captured by the values of
  and
and  .
.