
Figure 2. Comparison of the experimental and predicted values of the apparent stiffness  .
.
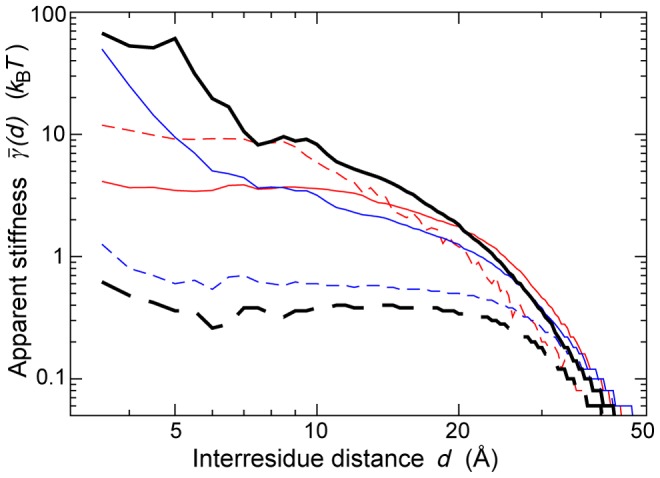
Experimental values of  (continuous black) and
  (dashed black), extracted from the dataset of 1500 NMR ensembles. Values of
  predicted on the same dataset by the
  (dashed red);
  (continuous red);
  (dashed blue);
  (continuous blue).