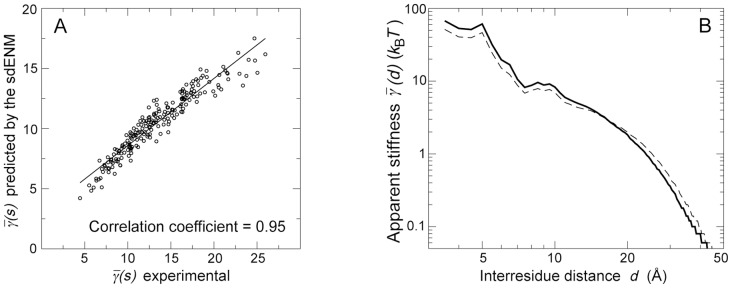
Figure 5. Performances of the sdENM in a mean protein environment.

(A) Experimental and predicted values of  , in the dataset of 1500 NMR ensembles. The Pearson correlation coefficient between predictions and experimental data is equal to 0.95 (
 ). See also Figures S3 and S5. (B) Experimental (continuous) and predicted (dashed) values of
  , in the dataset of 1500 NMR ensembles. See also Figure S2.
