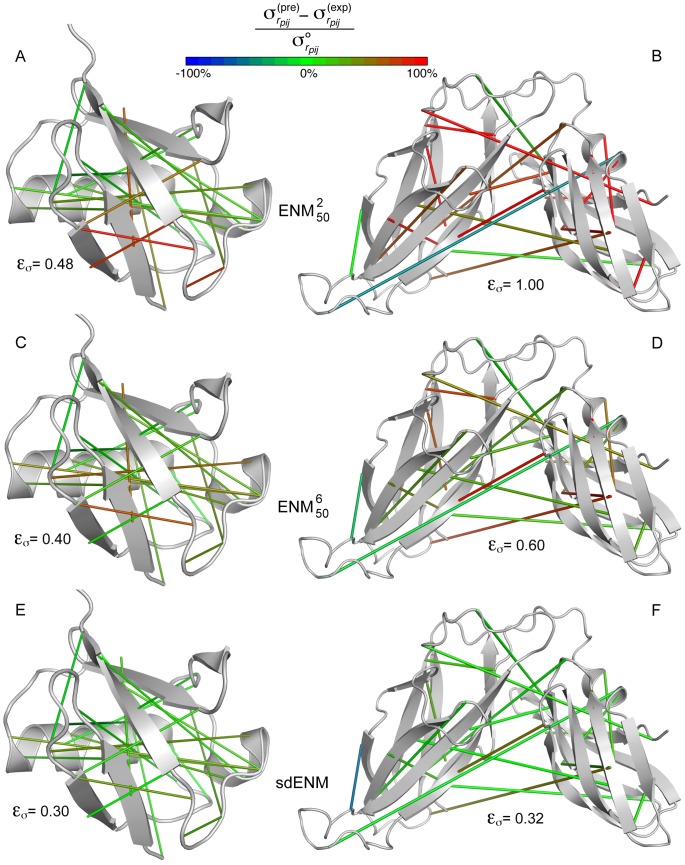
Figure 6. Performances of the sdENM on individual proteins.
The accuracy of the estimation of pairwise residue fluctuations by different ENM variants is illustrated on the basis of two individual proteins. For each protein, 20 randomly selected residue pairs (10 with  Å, and 10 with
  Å) are connected by solid lines. A green line indicates that the amplitude of the fluctuations of the interresidue distance is well estimated by the model. A red (blue) line indicates that the amplitude of the fluctuations of the interresidue distance is largely overestimated (underestimated) by the model. Values larger than 100% or lower than −100% are assimilated to 100% and −100%, respectively. In addition, for each protein and each ENM variant, we report the error
  on the estimation of pairwise fluctuations (eq. 15), which accounts for all pairs of residues in the protein. (A,C,E) High quality structural ensemble of ubiquitin, obtained by combining NMR information with molecular dynamics simulations (PDB: 1xqq) [38]. (B,D,F) NMR structural ensemble of periplasmic chaperone FimC (PDB: 1bf8). The relatively rigid orientation of the two domains is ensured by specific interdomain interactions [39]. (A–B)
  . (C–D)
  . (E–F)
  .
.

