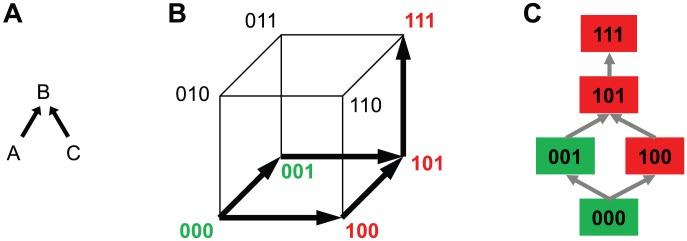
Figure 1. Schematic illustration of I-CBN model and individualized genetic barrier (IGB).

(A) A partially ordered set of three mutations,  ,
,  , and
, and  , is considered with the two relations
  and
and  , resulting in two possible escape pathways of the virus, namely
  or
or  . (B) The partial order constraints give rise to the genotype lattice consisting of genotypes 000, 001, 100, 101, and 111 indicated with bold arrows, where genotypes are encoded as binary strings such that 000 is the wild type
  (no mutations), 100 is defined by mutation
  and identified with
  , 101 with
  , etc. The genotype lattice
  is shown inside the embedding hypercube
  . For each antiretroviral drug, genotypes are labeled as either susceptible (green) or resistant (red). (C) Genotype lattice isolated from the embedding hypercube. The IGB is the probability of the virus not reaching a resistant state.
