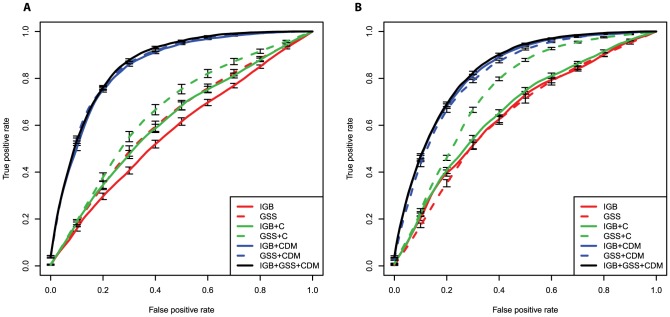
Figure 4. ROC curves quantifying the performance of elastic net regularized logistic regression models in predicting treatment outcome, defined as a reduction of viral load below 50 cps/ml (A) and 400 cps/ml (B).
The areas under the ROC curves (AUC values) are reported in Table S5 and Table S6. Prediction models are encoded by the sets of predictors used, where C refers to the demographic and clinical variables, D refers to drugs, and M to mutations. For example, the model IGB+CDM includes as predictors IGB to regimen, clinical and demographic predictors, applied drugs, and mutations. The models with all predictors perform significantly better than all other models.

