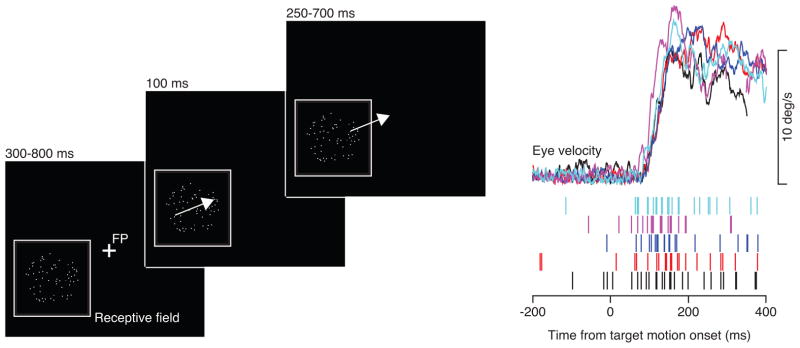
Figure 1.

The pursuit task. The schematic on the left shows the 3 important intervals in stimulus presentation, described in the text. The traces on the right show simultaneous recordings of smooth eye velocity and rasters indicating spikes in a single MT neuron, plotted as a function of time. Colors indicate the correspondence between spike trains and eye movements.
