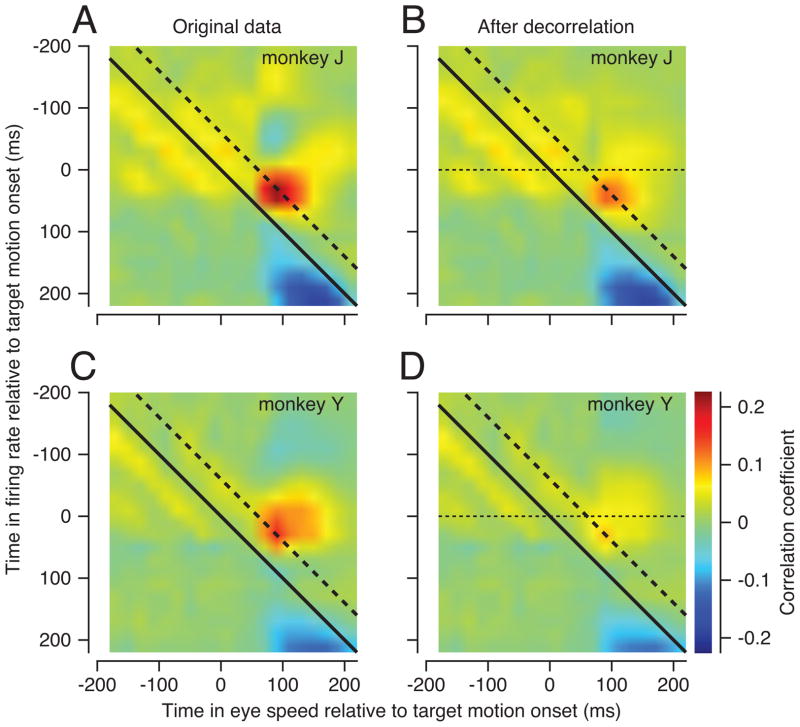
Figure 2.
MT-pursuit correlations. Each pixel shows the trial-by-trial correlation between MT firing rate at the time on the y-axis and eye speed at the time on the x-axis. Data are averaged across data for all neurons and all target motions in directions that were within 90 degrees of preferred direction. The dashed and continuous diagonal lines indicate pixels for firing rates that precede eye velocity by 60 or 0 ms. A, C: Correlations calculated on original data. B, D: Correlations calculated after removal of temporal autocorrelation from the initiation of pursuit.

