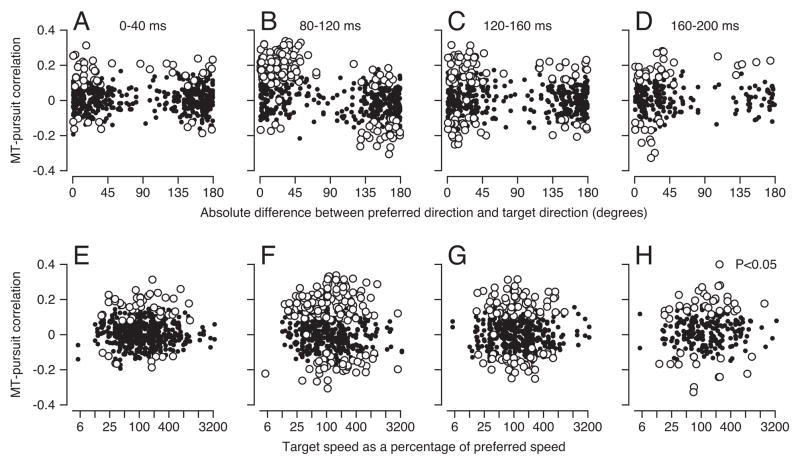
Figure 3.
MT-pursuit correlations as a function of the tuning properties of MT neurons. Each symbol shows results for one target motion in one neuron. Open and filled symbols indicate significant or non-significant correlations. A–D: Correlation coefficients between MT firing rates and eye speed plotted as a function of the difference between target direction and preferred direction of the neuron under study. E–H: Correlation coefficients between MT firing rates and eye speed plotted as a function of target speed as a percentage of preferred speed of the neuron under study. The four columns of graphs show correlations for different intervals of eye velocity, where the lag between firing rate and eye speed was held constant at 60 ms. The 0–40 ms interval occurs before any effect of visual motion; the other intervals represent the first 120 ms of pursuit.

