
Figure 5.
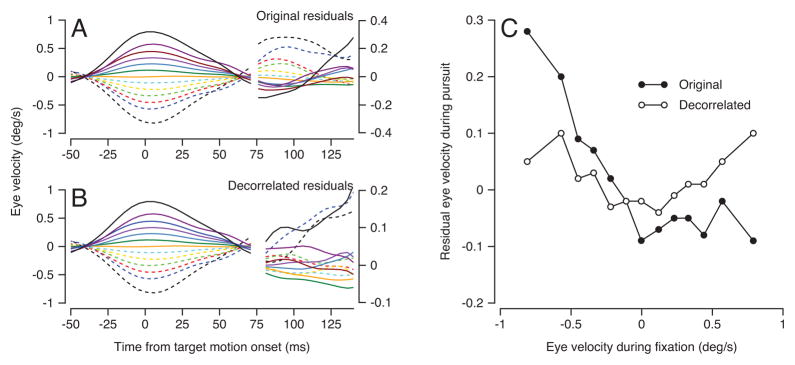
Effect of removing temporal autocorrelations in eye velocity. A, B: averages showing eye velocity projected onto the preferred direction of each neuron as a function of time before (A) and after (B) filtering to remove autocorrelations. Different colored traces show averages across trials in 13 bins according to the value of eye velocity at the time of target motion onset. The traces after the break are plotted at higher amplitudes to show the presence and absence of the autocorrelation more clearly. C: Graph of the residual eye velocity 100 ms after the onset of stimulus motion, during pursuit initiation, as a function of that during fixation, at the time of target motion onset. Open and filled symbols show data after versus before removal of the temporal autocorrelations in eye velocity.