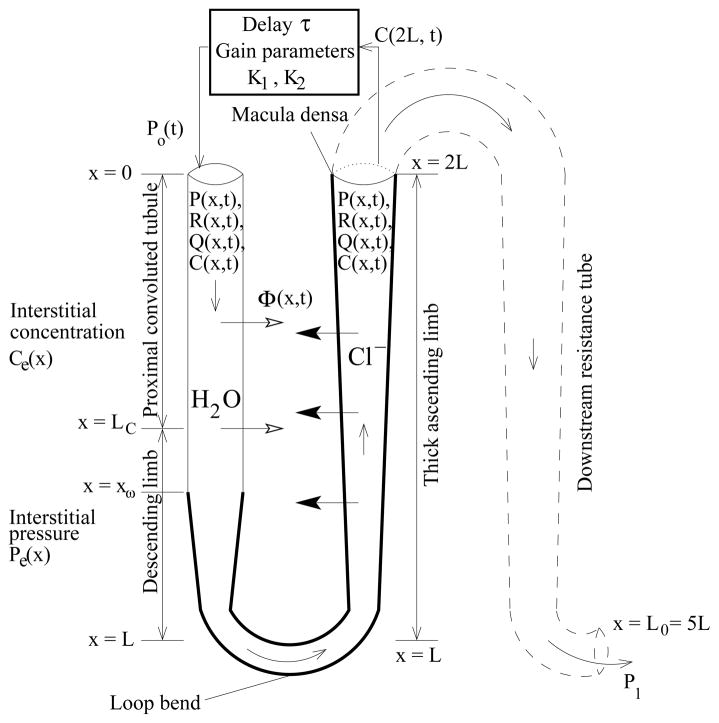
Fig. 2.
Schematic representation of model TGF system. Hydrodynamic pressure Po(t) = P(0, t) drives flow into loop entrance (x = 0) at time t. Oscillations in inflow pressure result in oscillations in loop pressure P(x, t), flow rate Q(x, t), water flux Φ(x, t), radius R(x, t), and tubular fluid chloride concentration C(x, t).

