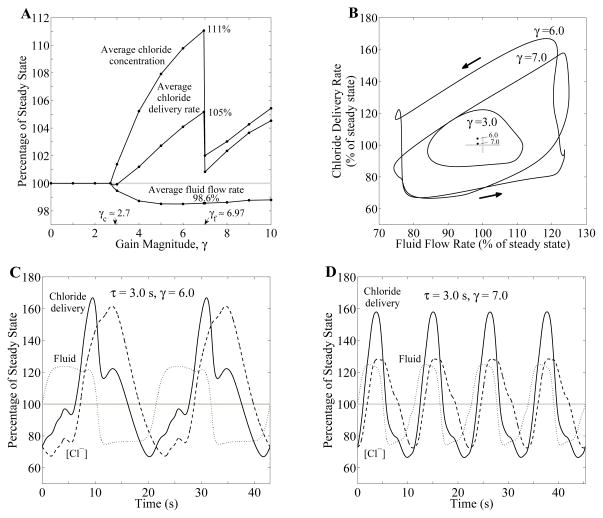
Fig. 8.
Effect of TGF gain γ on chloride delivery, with TGF delay τ = 3 s. A: Time-average MD fluid flow rate, chloride concentration, and chloride fluid delivery rate as functions of gain magnitude γ. B: phase plots, showing MD chloride delivery rate as a function of TAL fluid flow rate determined at the MD, for selected gain values γ. Arrows indicate direction of time evolution. The phase curve corresponding to higher frequency oscillation (γ = 7) is much smaller compared to the curve for γ = 6. Inset: time-averaged fluid flow and chloride delivery rates for selective gain values. C and D: oscillations in TAL fluid flow rate (dotted curve), chloride concentration at the MD (dashed curve), and chloride delivery rate to the MD (solid curve), for γ = 6 and γ = 7, respectively. Variables are expressed as percentages of steady-state base-case values.

