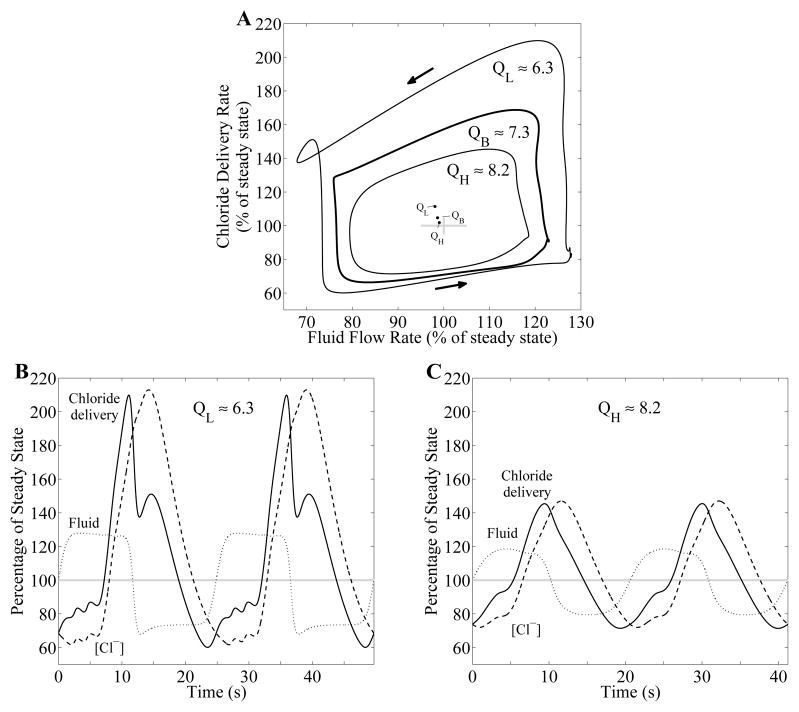
Fig. 9.
Effect of TAL fluid flow rate on chloride delivery with TGF delay τ = 3.5 s and gain γ = 5. A: phase plots, showing chloride delivery rate to MD as a function of TAL fluid flow rate, for selected TAL fluid flow rates (in nl/min), QL = 6.3, QB = 7.3 (base-case), and QH = 8.2 nl/min. Inset: time-averaged fluid flow and chloride delivery rates. As fluid flow rate in the TAL is increased, time-averaged chloride delivery rate is decreased while time-averaged flow rate is increased. B and C: oscillations in TAL fluid flow rate (dotted curve), chloride concentration at the MD (dashed curve), and chloride delivery rate to the MD (solid curve). Variables are expressed as percentages of corresponding steady-state base-case values.

