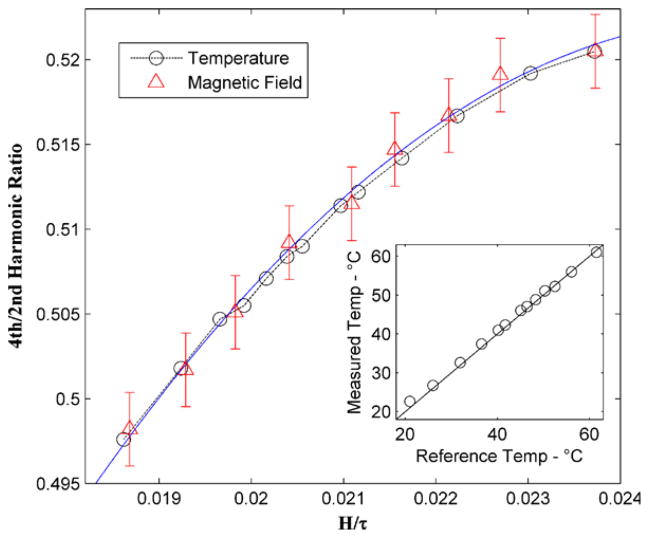
Figure 3.
Temperature and calibration curves for Feridex excited at 4050 Hz. Temperature effects on saturation magnetization were corrected for using b = 2.8E-5 and a = 1.64. The ratio of the dc/ac magnetic field strength was kept constant at 0.46. The solid line is a quadratic fit to the magnetic field variation curve. The temperature range was 21–61 °C. Error bars represent the inaccuracy in static field measurement and inhomogeneity. Inset: comparison of reference temperature from thermometer and temperature measured using harmonic ratio. The line is an ideal fit.

