
Fig. 2.
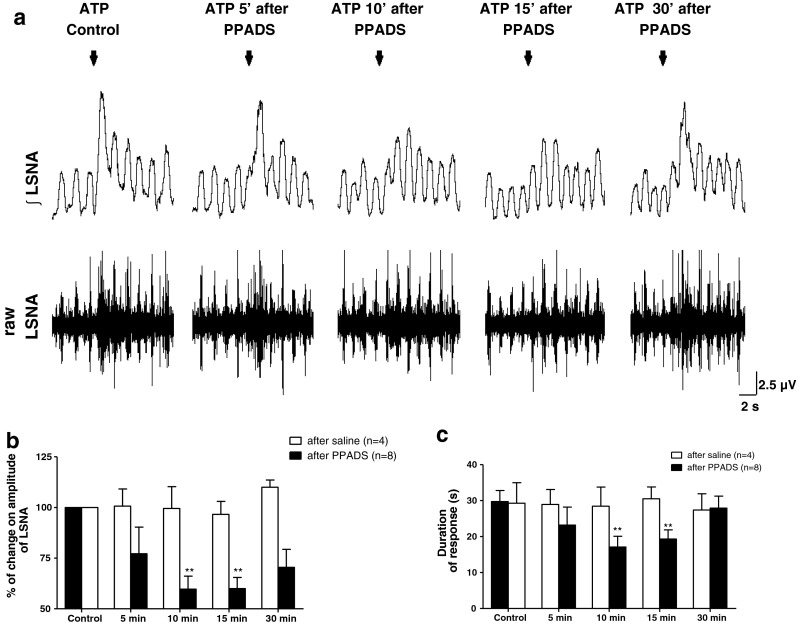
a Representative traces of one animal showing the effects of ATP (2.5 nmol) microinjection into the PVN on raw and integrated (integral sign) LSNA before and after antagonism of P2 receptors (PPADS, 0.5 nmol) at the same site. Arrows show the time of injection. b and c The percentage of change on magnitude of LSNA (%) and duration time of response(s), respectively, induced by ATP before and after PPADS microinjection into the PVN. Note that the ATP-mediated sympathoexcitation is not altered by previous injection of saline. Results are shown as mean ± SEM. **p < 0.01, compared to ATP control vs. ATP in the presence of PPADS, One-way repeated measures ANOVA with Bonferroni’s post hoc test