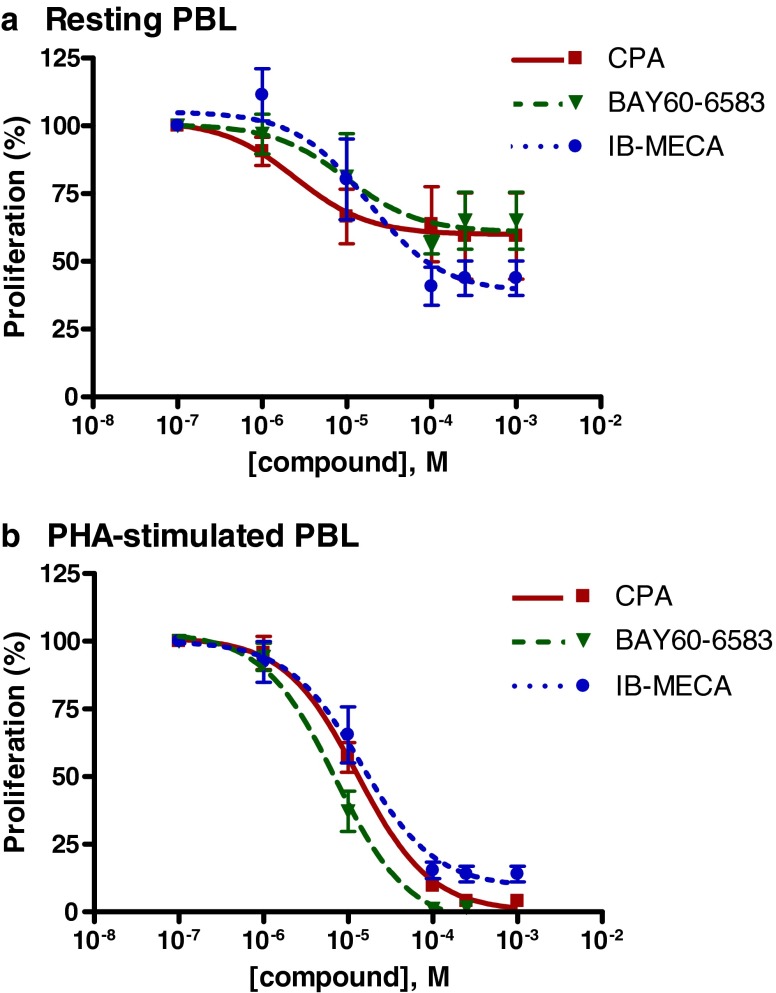
Fig. 4.
Dose–response curves obtained with [3H]thymidine incorporation studies in unstimulated PBL (a) and PHA-stimulated PBL (b). Each data point represents the mean of a minimum of three separate experiments carried out in triplicate ± SEM (for IC50 values, see Table 2)

