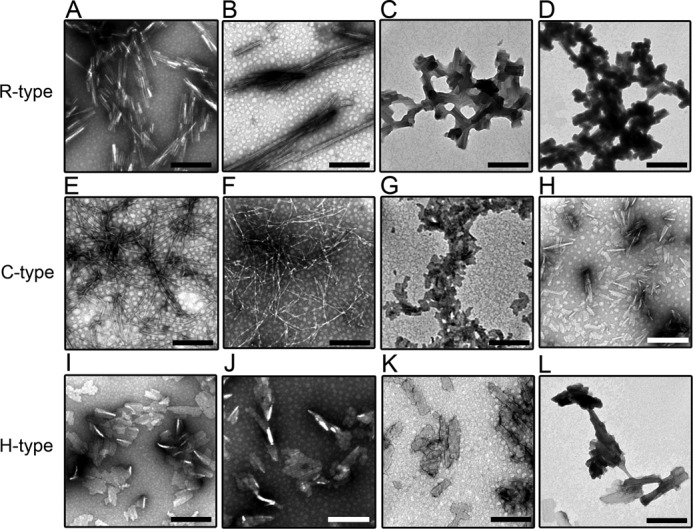
FIGURE 4.

High-magnification TEM images of the amyloid fibrils of the R- (A–D), C- (E–H), and H-type (I–L) peptides in the absence and presence of BAC. The BAC concentrations were 0 (A, E, and I), 0.01 (B, F, and J), 0.3 (C, G, and K), and 1.5 mm (D, H, and L). When the concentration of BAC was increased, the bundles of amyloid fibrils became thicker in the R- and H-type peptides. The scale bars represent 200 nm.
