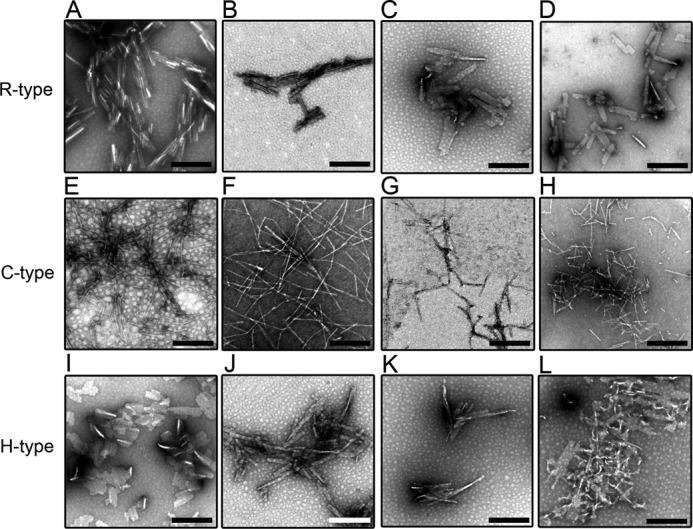
FIGURE 5.

High-magnification TEM images of amyloid fibrils of the R- (A–D), C- (E–H), and H-type (I–L) peptides in the absence and presence of SDS. The SDS concentrations were 0 (A, E, and I), 0.01 (B, F, and J), 0.3 (C, G, and K), and 1.5 mm (D, H, and L). The addition of SDS did not have any significant effects on the morphology of the amyloid fibrils. The scale bars represent 200 nm.
