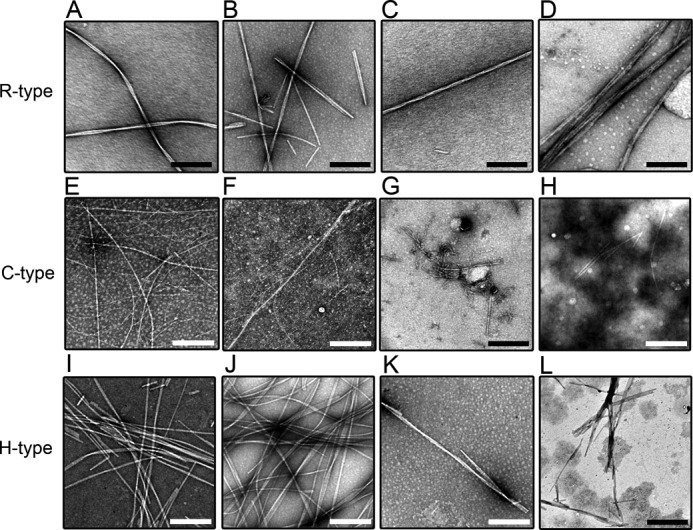
FIGURE 8.

High-magnification TEM images of seed-dependent amyloid fibrils with the various concentrations of BAC. R- (A–D), C- (E–H), and H-type (I–L) peptides. BAC was added at 0 (A, E, and I), 0.01 (B, F, and J), 0.1 (C, G, and K), and 1.0 mm (D, H, and L). The scale bars represent 200 nm.
