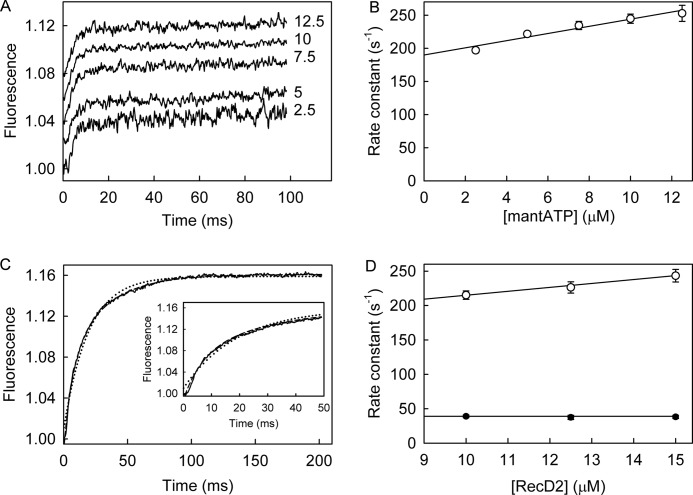
FIGURE 3.
MantATP binding to RecD2·dT20. MantATP at the micromolar concentrations shown was mixed in the stopped flow apparatus with 0.5 μm RecD2 and 2.5 μm dT20 at 20 °C in the buffer described under “Experimental Procedures.” A, individual traces (offset from each other) were fitted to single exponentials (Equation 1), and the dependence of the observed rate constants on concentration was then linear-fitted to Equation 3 (B). The points shown are averages of at least three measurements. The slope gives k+1 as 5.4 ± 0.8 μm−1s−1. The intercept with the ordinate (190 ± 8 s−1) represents k−1 + k+2 (scheme in Fig. 1A). C, shown is the time course after mixing 12.5 μm RecD2 and 15 μm dT20 with 2.5 μm mantATP. The inset shows the initial increase in fluorescence. The complete trace was fitted by a double exponential (Equation 2, dashed line), and the single exponential fit is shown for comparison (dotted line). The first phase, representing two-thirds of the amplitude, had an observed rate constant of 248 ± 7 s−1, and the second phase was 38.4 ± 2.4 s−1. D, traces were fitted to double exponentials, and the dependence of the observed rate constants on concentration was fitted to Equation 3. The observed rate constant for the initial change in fluorescence is linearly dependent on the RecD2 concentration (unfilled circles). After a linear fit to Equation 3, the second order association rate constant was 5.7 ± 0.7 μm−1s−1, and the intercept was 158 ± 9 s−1. The observed rate constants of the second increase in fluorescence (filled circles) were independent of RecD2 concentration at 39 s−1.

