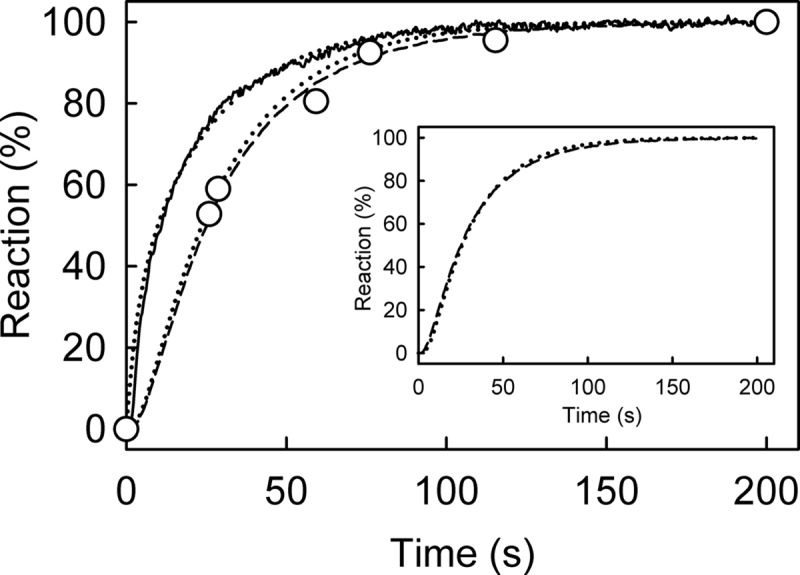
FIGURE 5.

Kinetic measurement of mantATP with excess of RecD2·dT20: binding, hydrolysis, and Pi release. Time course of mant fluorescence (solid line), mantADP formation (circles), and Pi release (dashed line) is shown. All measurements were at 2.5 μm mantATP, 12.5 μm RecD2, 15 μm dT20, and 10 μm MDCC-PBP (for Pi measurement) and were carried out under the conditions of Fig. 3 as described under “Experimental Procedures.” The time courses were simulated (dotted lines), based upon a global model for a single turnover of mantATP based on the scheme in Fig. 1B, as described under “Results.” The simulated mant fluorescence and cleavage time course are in the main panel, and the Pi simulation with the experimental data is in the inset. This gave an observed first order rate constant for mantATP binding ([RecD2] × k+1a) at 200 s−1 followed by the conformation change (k+1b) at 54 s−1, hydrolysis (k+2) at >300 s−1; Pi release (k+3) was fast (>300 s−1).
