FIGURE 6.

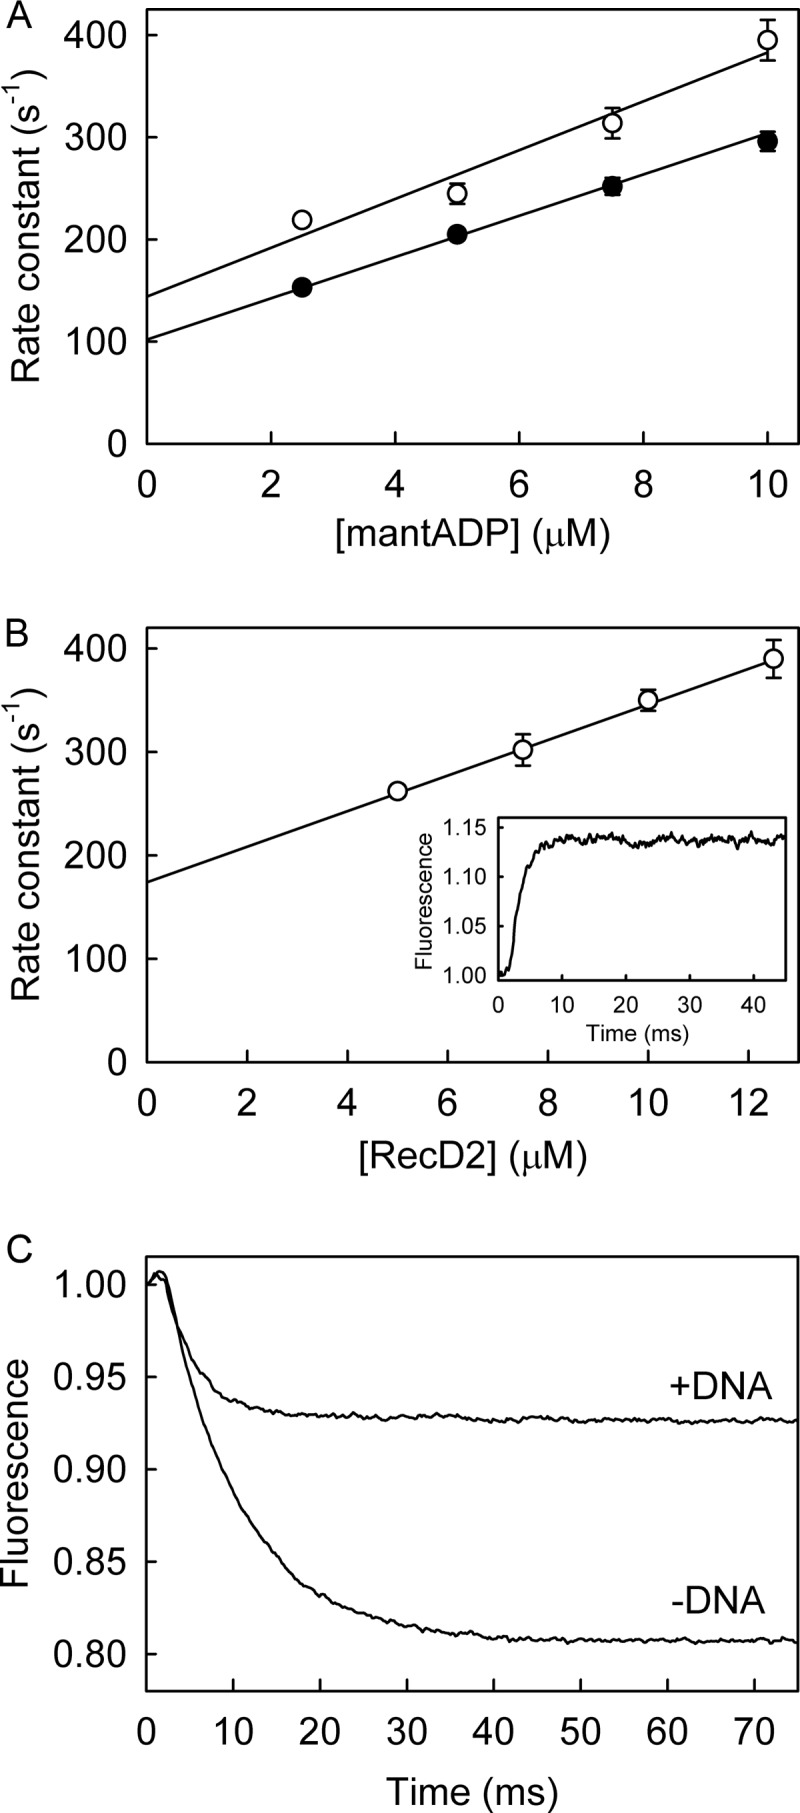
MantADP binding kinetics to RecD2·dT20. A, mantADP at various concentrations was mixed in the stopped flow apparatus with 0.5 μm RecD2 with (open circles) or without (filled circles) 2.5 μm dT20 under the conditions of Fig. 3. Traces were fitted by single exponentials (Equation 1). The rate constants are shown as a function of concentration and the best linear fit (Equation 3) and give an association rate constant of 23.9 ± 3.6 μm−1 s−1 and a dissociation rate constant of 144 ± 25 s−1. B, RecD2 at various concentrations was mixed against 2.5 μm mantATP in the presence of 15 μm dT20. The traces were fitted by single exponentials, and the resulting observed rate constants are plotted against concentration. A linear fit (Equation 3) gives an association rate constant with dT20 bound of 17.2 ± 1.3 μm−1 s−1 from the slope and a dissociation rate constant of 174 ± 5 s−1 from the intercept. In the absence of DNA, the fit gives an association rate constant of 20.2 ± 1.2 μm−1 s−1 and dissociation rate constant of 102 ± 9 s−1. Inset, shown is the time course of an excess of 12.5 μm RecD2 (15 μm dT20) binding 2.5 μm mantATP. C, MantADP release from RecD2·dT20 is shown. 12.5 μm RecD2 was premixed with 2.5 μm mantADP in the presence or absence of 15 μm dT20 before being rapidly mixed against 200 μm ADP. The time course, after the apparent lag due to the dead time of the stopped flow instrument (∼2 ms), was fitted to a single exponential giving a dissociation rate constant of 240 ± 3 s−1.
