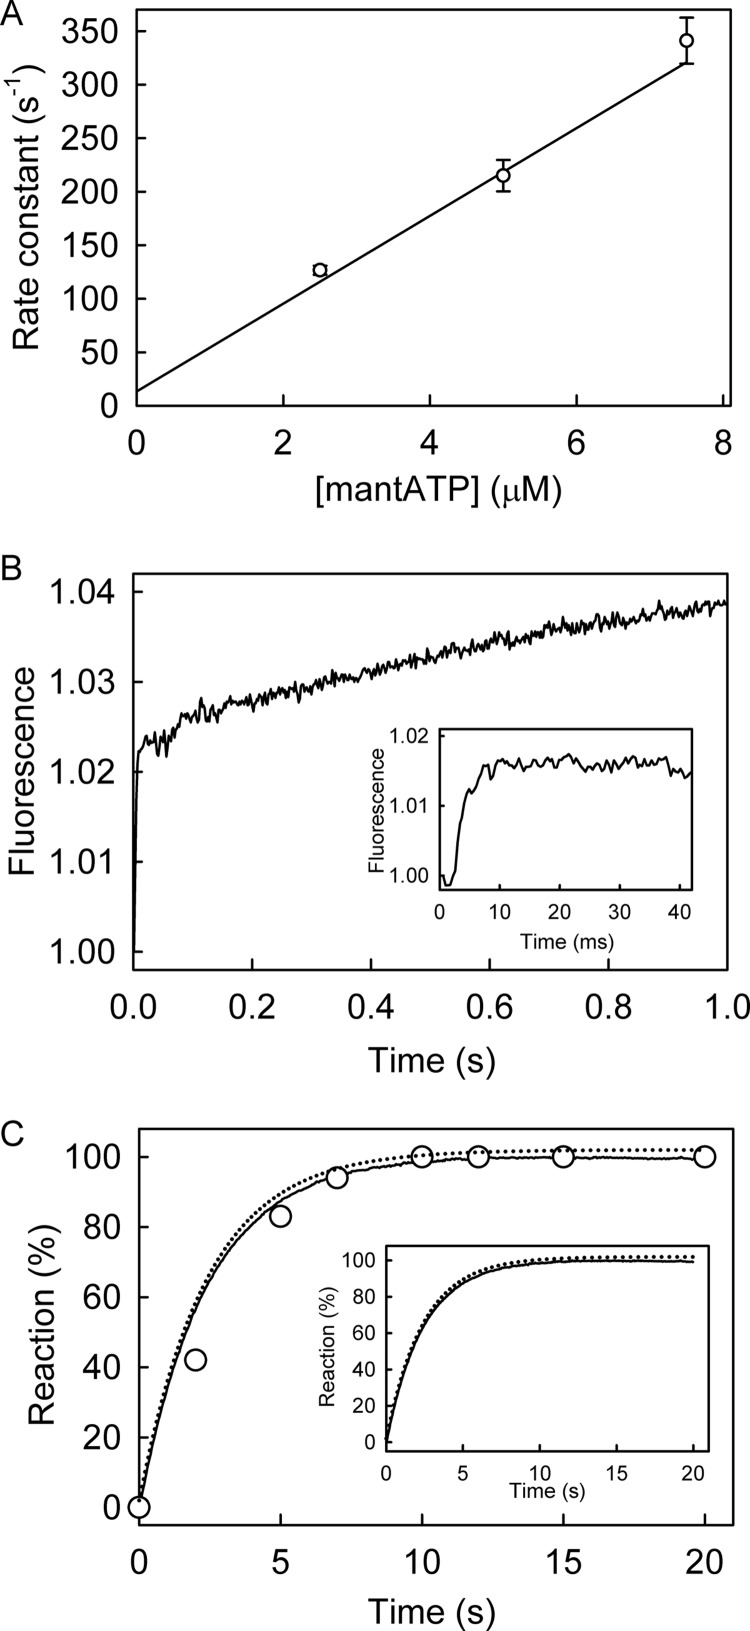
FIGURE 7.
MantATP measurements in the absence of DNA. A, MantATP at the micromolar concentrations shown was mixed in the stopped flow apparatus with 0.5 μm RecD2 under the conditions of Fig. 3. Traces were fitted by single exponentials (Equation 1), and the dependence of the observed rate constants on concentration was then linear fitted to Equation 3. The fit gives an association rate constant of 42.8 ± 4.4 μm−1s−1. The intercept gives the dissociation rate constant of 13.4 ± 5.8 s−1. B, the time course of 12.5 μm RecD2 binding 2.5 μm mantATP is shown. The inset shows the initial increase in fluorescence. Fitting the first phases, after the apparent lag due to the dead time of the stopped flow instrument (∼2 ms), to a single exponentials gave an observed rate constant of 296 ± 22 s−1. The slow second phase is probably the slow hydrolysis. C, shown is the time course of mantADP formation (circles) and Pi release (solid line), measured as described under “Experimental Procedures.” The simulation from Fig. 5 was applied to fit the acid quench (dotted line in the main panel) and Pi release data (dotted line in the inset together with the data). Both simulated lines are offset by 2% for clarity This gave the observed first order rate constant for mantATP binding at 250 s−1 followed by a conformation change 0.5 s−1 followed by fast hydrolytic cleavage and Pi release.

