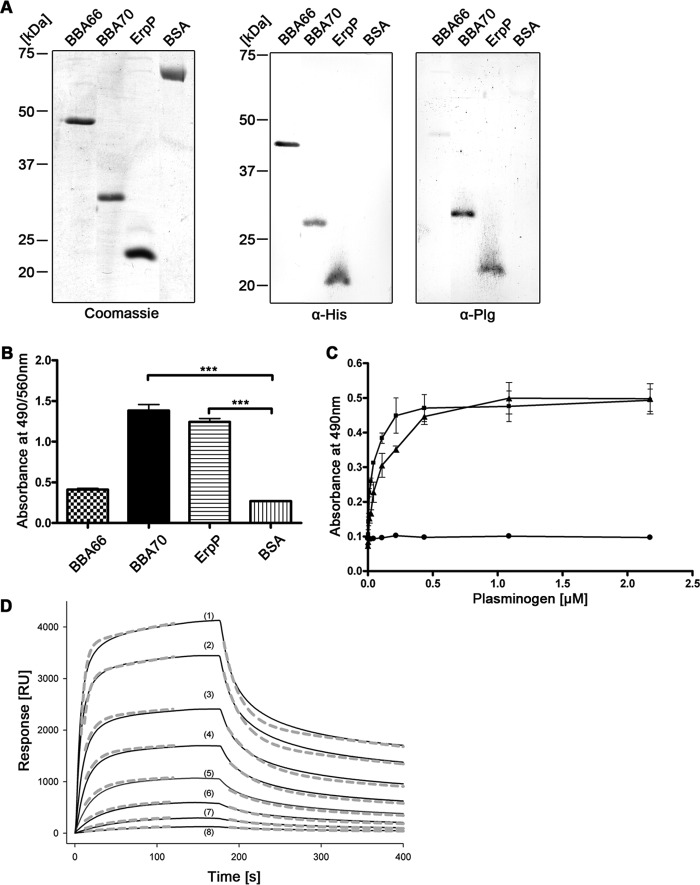
FIGURE 1.
B. burgdorferi BBA70 binds human plasminogen. A, recombinant, hexahistidine-tagged borrelial proteins or BSA (1 μg each) were separated via SDS-PAGE for Coomassie staining in order to ensure sufficient purity of the recombinant proteins (left). For Western blotting, 250 ng of the respective borrelial proteins and BSA were subjected to SDS-PAGE and subsequently transferred to nitrocellulose. Detection of hexahistidine tag was performed as loading control (center), and ligand affinity blotting was employed to test for plasminogen binding. The membrane was incubated with 20 μg/ml purified human plasminogen, and bound plasminogen was detected using a polyclonal plasminogen antiserum (α-Plg) and HRP-conjugated secondary antibody (right). B, binding of plasminogen was verified for recombinant proteins using ELISA. Hexahistidine-tagged recombinant proteins or BSA (5 μg/ml each) was immobilized onto microtiter plates and incubated with 10 μg/ml purified human plasminogen. Bound plasminogen was detected using a polyclonal plasminogen antiserum and HRP-conjugated anti-goat immunoglobulins. Absorbance was measured at 490/560 nm. Experiments were each performed in triplicate, and graphs represent means from at least three independent experiments. Error bars, S.E. ***, p < 0.001 (one-way ANOVA with Bonferroni's multiple-comparison test). C, ELISA was performed to determine dose dependence. BBA70 (■), ErpP (▴), and BSA (●) (5 μg/ml each) were immobilized onto microtiter plates and incubated with increasing concentrations of purified human plasminogen. Detection was performed as described previously, and absorbance was measured at 490 nm. Data points represent means from three independent experiments, each performed in triplicate. Error bars, S.E. D, representative SPR binding and dissociation kinetics of human plasminogen to BBA70 immobilized on a Ni2+-nitrilotriacetic acid surface. Sensograms (solid lines) obtained when plasminogen solutions at the indicated concentrations were flowed across the sensor chip and the experimental data were fitted (dashed lines) with the two-state binding model, where A + B ↔ AB ↔ AB* (see “Experimental Procedures”). The resulting rate and affinity constants are given in Table 2 (mean ± S.D.). Plasminogen concentrations are 3410 nm (1), 2270 nm (2), 1136 nm (3), 620 nm (4), 324 nm (5), 133 nm (6), 67 nm (7), and 33 nm (8). RU, response units.

