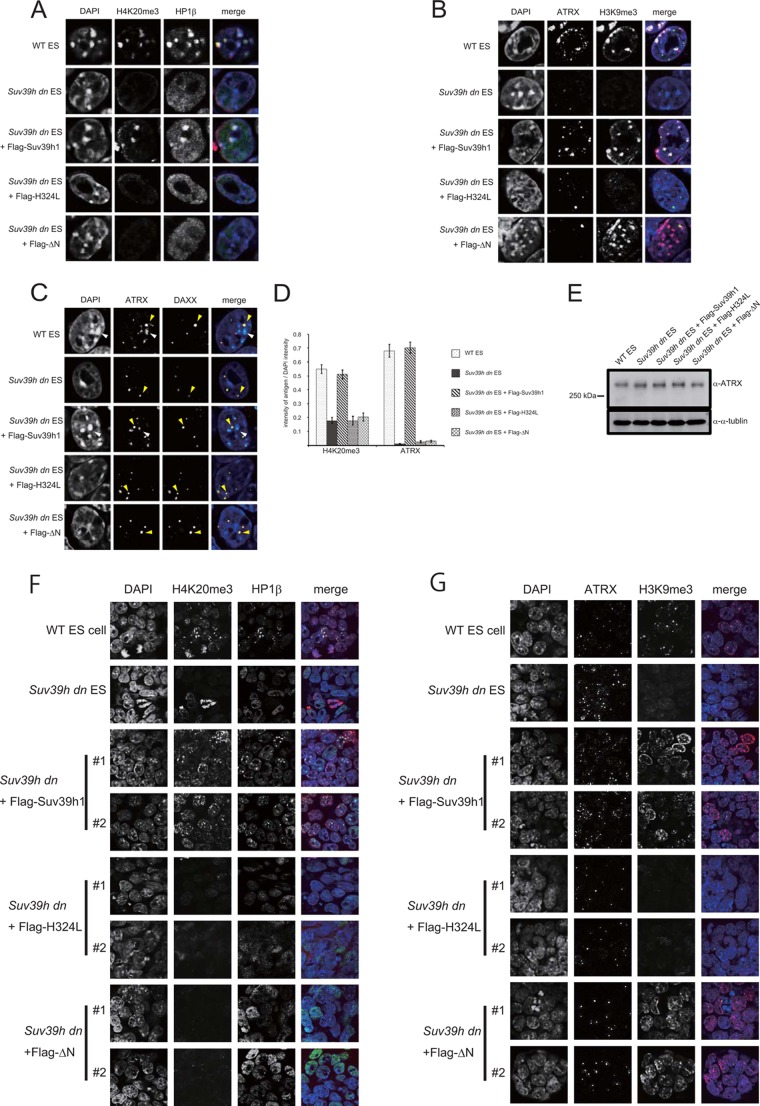
FIGURE 3.
ATRX and H4K20me3 pericentromere accumulations were not restored in the Suv39h dn ES cells expressing Suv39h1ΔN. Immunohistochemical staining analysis for H4K20me3 (red) and HP1β (green) (A), H3K9me3 (red) and ATRX (green) (B), and DAXX (red) and ATRX (green) (C) were conducted with WT or Suv39h dn ES cells or Suv39h dn ES cells complemented with either FLAG-tagged WT Suv39h1, H324L, or ΔN. DNA was counterstained with DAPI (blue). C, white and yellow arrowheads shows the DAPI-dense pericentric chromocenter and DAXX-positive promyelocytic leukemia nuclear body, respectively. D, DAPI intensity and the intensity of the antigen at the same region were quantified using ImageJ based on the fluorescence imaging data obtained for A and B. The intensities for 30 cells were quantified. The value of each antigen was expressed as a ratio between the DAPI intensity and the intensity of the antigen being measured. E, Western blot analysis for ATRX expression in the indicated cell lines. F and G, immunohistochemical staining analysis for the two independent cell lines indicated at low magnification. A combination of color and antigen was same as that observed for A and B.

