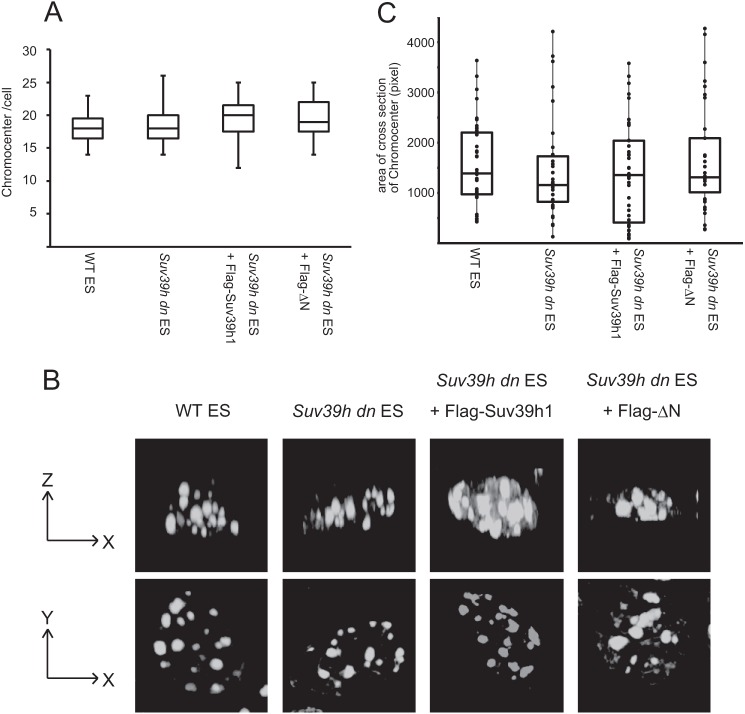
FIGURE 4.
Chromatin compaction was not significantly altered in mouse ES cells after Suv39h depletion. A, boxplot representation of the number of chromocenters per cell for the indicated ES cell lines. n = 30. There were no significant differences between WT and Suv39h dn or other rescued cell lines (p > 0.1, Student's t test). B, three-dimensional constructed images of DAPI-dense chromocenters for the indicated ES cell lines. The indicated cells were stained by DAPI, and 25 two-dimensional pictures at different focal positions were taken. A three-dimensional image was constructed from the data obtained in the two-dimensional pictures. The X-Z and X-Y images are shown. C, boxplot and dotplot representation of the measured value of each area of DAPI-dense chromocenter from A (X-Y images). Analyzed cell number = 3. There were no significant differences between WT and Suv39h dn or other rescued cell lines (p > 0.1).

