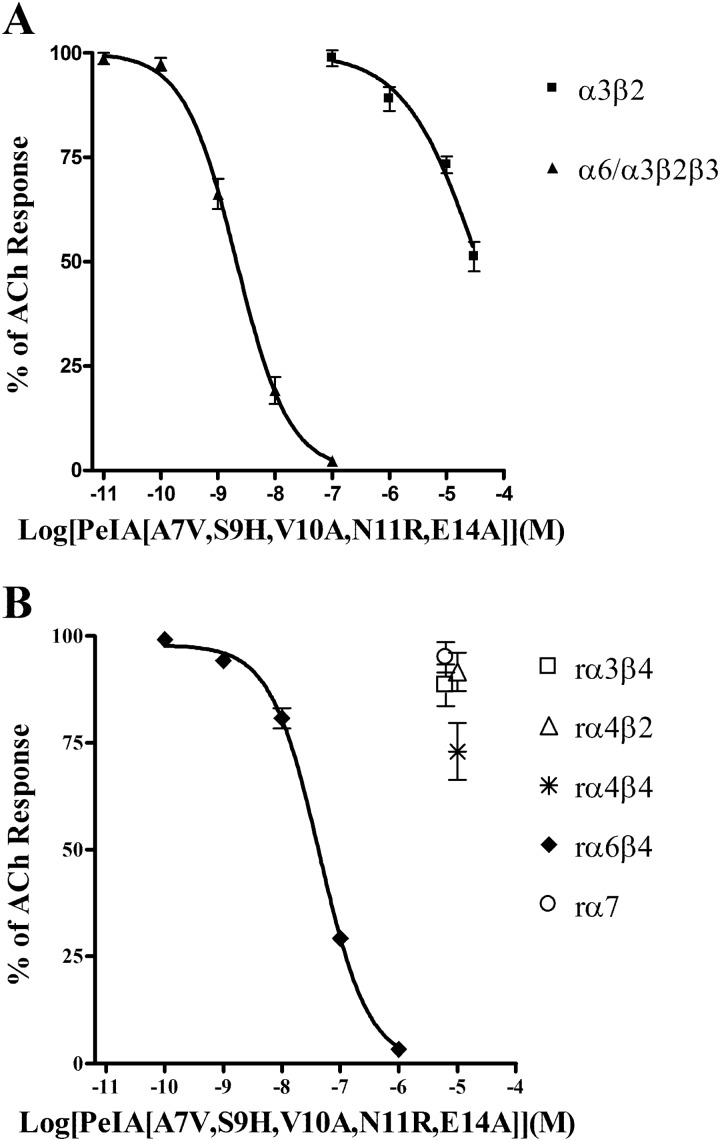
FIGURE 5.
Potency and selectivity profile of PeIA(A7V,S9H,V10A,N11R,E14A) for several rat nAChR subtypes. Xenopus oocytes expressing different nAChRs were subjected to TEVC as described under “Experimental Procedures,” and the IC50 values for inhibition of the IACh by PeIA(A7V,S9H,V10A,N11R,E14A) were determined. A, concentration-response analysis for inhibition of α6/α3β2β3 and α3β2 nAChRs. B, concentration-response analysis for inhibition of α3β4, α4β2, α4β4, α6β4, and α7 nAChRs. In B, the 10 μm data points for α3β4, α4β2, α4β4, and α7 nAChRs are shown staggered to avoid overlap. The IC50 values are summarized in Table 4. Error bars, S.E. from 4–5 oocytes for each experimental determination.

