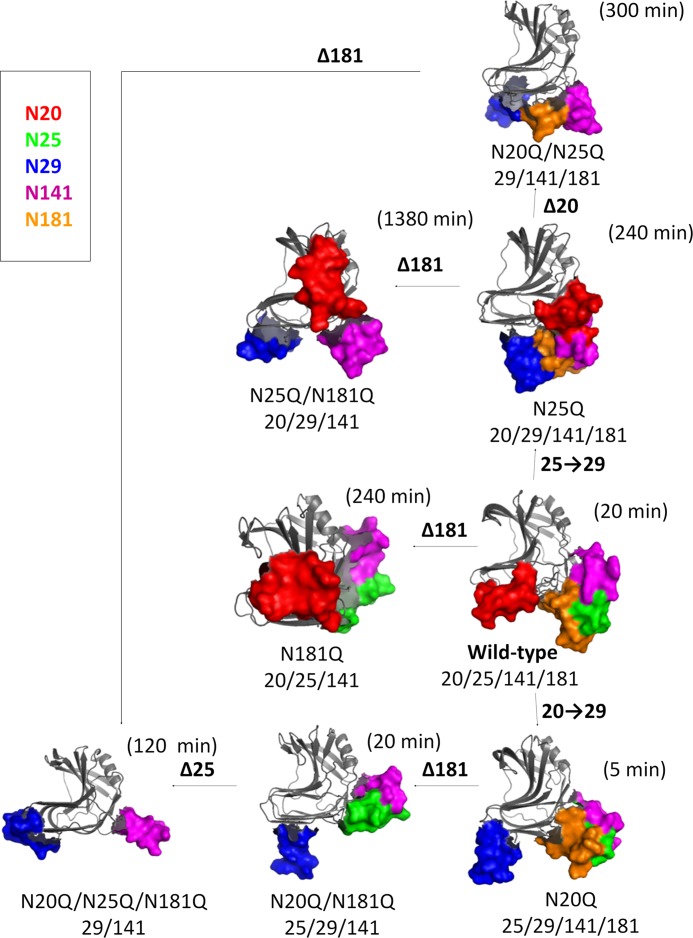
FIGURE 7.
Snapshots of MD simulations of the conformations of glycosylated mutants of xylanase A. The structures are ribbon representations of the average stabilized structures obtained every 0.5 ps from MD calculations at 328 K over the final 15 ns of the trajectory. The polypeptide portions of the molecules are represented by gray ribbons, whereas the glycan portions are represented as solid molecular surfaces in different colors according to their positions (glycosylation sites): red for the glycan at Asn20, green for the glycan at Asn25, blue for the glycan at Asn29, magenta for the glycan at Asn141, and orange for the glycan at Asn181. These figures were generated using the PyMOL software (PyMOL Molecular Graphics System, version 1.5, Schrödinger, LLC).

