FIGURE 3.
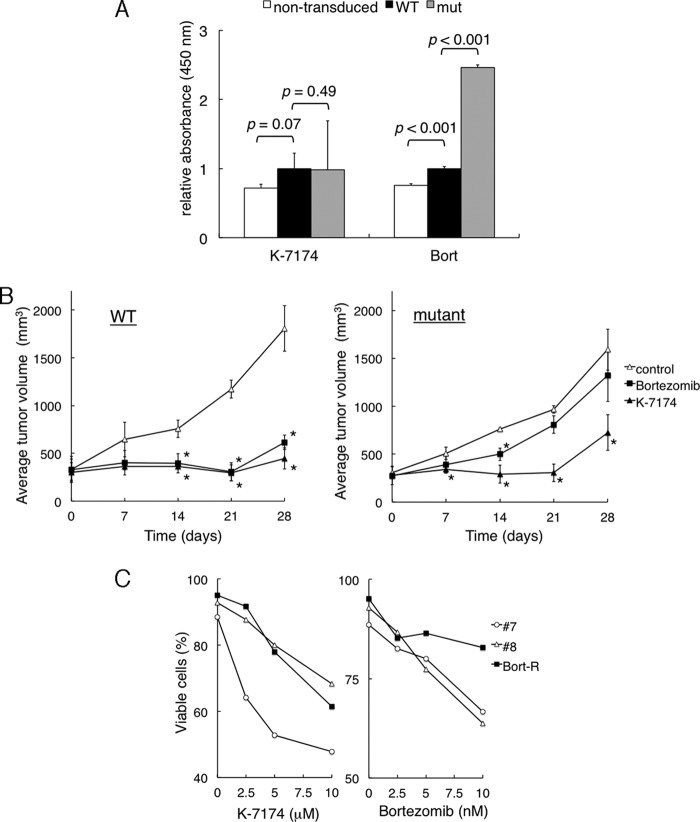
Cytotoxic effects of K-7174 on bortezomib-resistant MM cells. We established wild-type (WT) and mutant (mut) sublines from RPMI8226 by transducing with wild-type and mutated PSMB5 cDNA, respectively. A, cell proliferation was measured by MTT assays after culturing non-transduced cells and each subline with either K-7174 or bortezomib for 72 h. The y axis shows the relative absorbance setting wild-type values to 1.0. p values were calculated by one-way analysis of variance with the Student-Newman-Keuls multiple comparisons test. B, NOD/SCID mice were inoculated subcutaneously with 1 × 10⁷ cells of wild-type (WT) or mutant (mutant) subline into the right thigh. Mice were treated with the vehicle (3% DMSO in 0.9% NaCl) alone (control, open triangle; n = 3), bortezomib, 0.5 mg/kg, intravenously twice a week (Bortezomib, closed square; n = 4), or K-7174, 50 mg/kg, post-orally once daily (K-7174, closed triangle; n = 4), respectively, for 2 weeks. The y axis shows the average tumor volume in inoculated mice (bars indicate S.D.). p values were calculated by one-way analysis of variance with the Student-Newman-Keuls multiple comparisons test. Asterisks indicate p < 0.05 against the vehicle control. C, primary MM cells were cultured with either K-7174 or bortezomib at the indicated doses for 48 h. Cell death/apoptosis was determined by reactivity with annexin-V on a flow cytometer. The y axis shows the proportion of annexin-V-positive cells (%).

