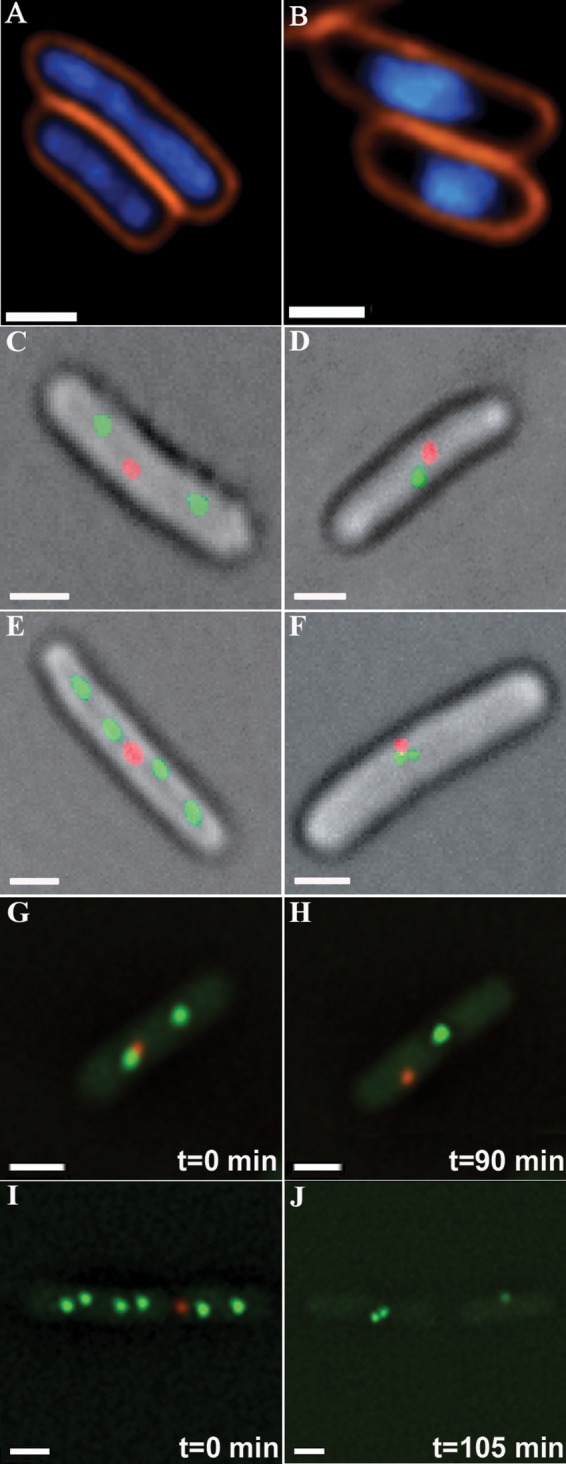
FIGURE 2.

Chromosomal organization and site localization in E. coli (FROS 1) exposed to NA. A, expanded genomes in unstressed cells. B, genome condensation following exposure to NA (1 h; 350 μg/ml) (DNA stained blue with DAPI, and cell membranes stained orange with FM4-64). C, E, G, and I, unstressed cells carrying FROS 1 (Fig. 1A) reveal two or four origin-proximal foci (green) and a single terminus-proximal focus (red). D, F, H, and J, following NA treatment, two foci coalesce into a single focus, and four foci merge into two adjacent foci. G, I, H, and J are initial and final frames from time-lapse experiments (supplemental Movies S1 and S2, respectively). Notably, two cells are depicted in I and J. Scale bars, 0.5 μm.
