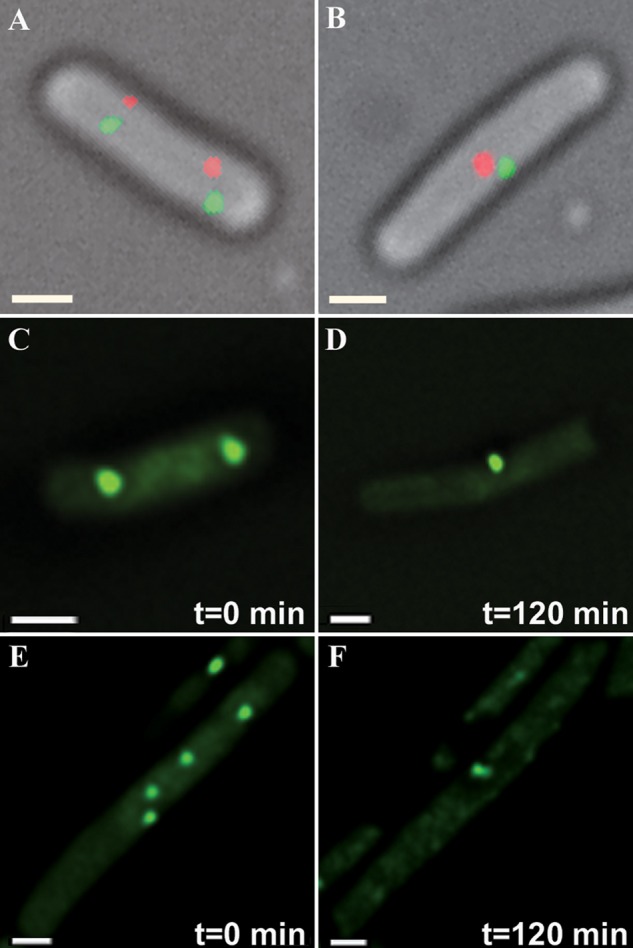
FIGURE 3.

Chromosomal site localization in E. coli (FROS 2) exposed to NA. A, C, and E, distribution of chromosomal foci in nonstressed E. coli cells carrying FROS 2 (Fig. 1B). B, D, and F, cells exposed to NA, revealing co-localization of homologous but not of nonhomologous sequences (red and green foci). C–F (supplemental Movie S3) represent the initial and final frames from time-lapse experiments. In the time-lapse studies only the tetO array (270° chromosomal site) was probed due to rapid eCFP bleaching. Scale bars, 0.5 μm.
