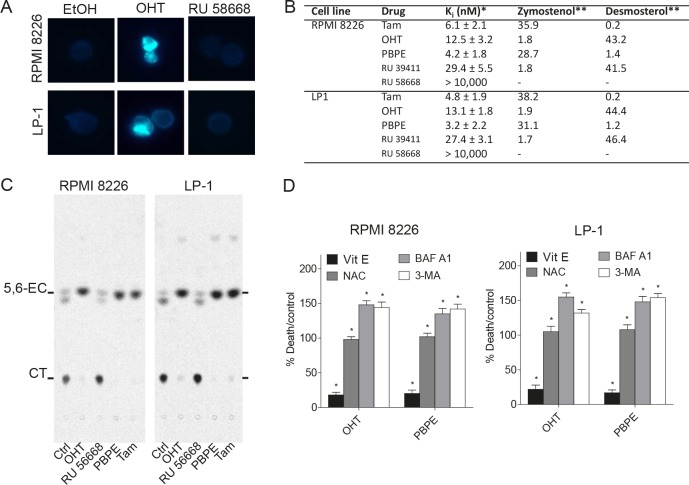
Figure 3. OHT and AEBS ligands induce the accumulation of cholesterol precursors in HMCLs.
A) RPMI 8226 and LP-1 cells were treated with EtOH or OHT (10 μM) for 48 h and cytospinned. Slides were stained with filipin and analyzed. Cells containing free sterols are colored in blue. Cells were visualized in the ultraviolet range using a x40 objective on a Zeiss LSM 510 microscope (Göettingen, Germany). B) The sterols accumulated in RPMI 8226 and LP-1 cells after 48 h incubation with SERMs, SERDs and selective AEBS/ChEH ligands were determined and quantified. Analyses were performed by HPLC and GC/MS as described in the Methods section. The cholesterol intermediates were quantified as a percent by the weight of total sterol. The amount of zymostenol and desmosterol was quantified by references to an external standard. C) HMCLs were treated with EtOH, OHT (10 μM), Tam (10 μM), RU 58668 (10 μM) or PBPE (40 μM) for 24 h and incubated with 0.6 μM [14C]-EC for 48 h and ChEH activity was assayed by measuring the conversion of CE into CT by TLC. A representative autoradiogram from three independent experiments is shown. D) RPMI 8226 and LP-1 cells were pre-incubated with 500 μM Vit E, 1 mM NAC, 50 nM BAF A1 or 10 mM 3-MA and then challenged with OHT (10 μM) or PBPE (40 μM) for 72 h. Cell death was determined by Trypan blue exclusion. Data were expressed as the percentage of cell death relative to control cells that received OHT (10 μM) or PBPE (40 μM). Experiments were repeated three times in duplicate with comparable results. The data present ed here are the means ± SEM of all experiments. *, p<0.001.

