An official website of the United States government
Here's how you know
Official websites use .gov
A
.gov website belongs to an official
government organization in the United States.
Secure .gov websites use HTTPS
A lock (
) or https:// means you've safely
connected to the .gov website. Share sensitive
information only on official, secure websites.

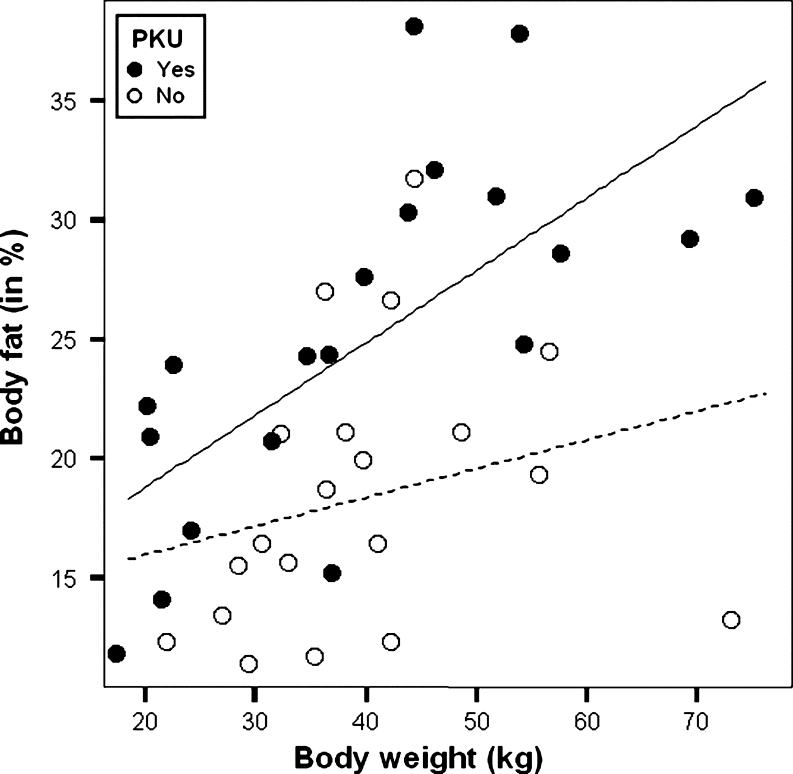
 ) (R = 0.693, p = 0.001)*(—) and in 20 healthy control subjects (
 ) (R = 0.250, p = 0.287) (------). *p < 0.05