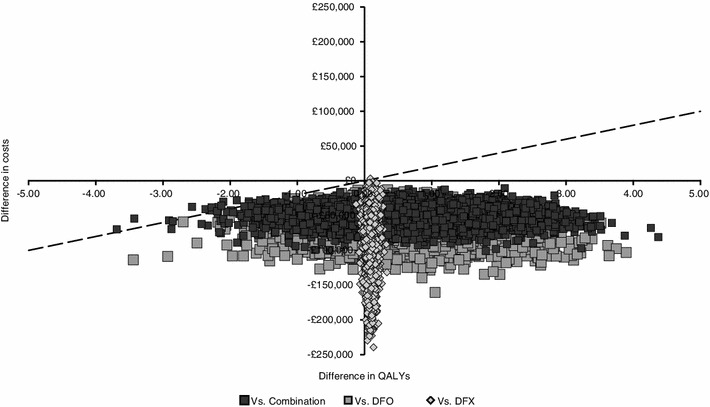
Fig. 3.

Cost-effectiveness plane—incremental costs and effects for DFP vs comparators. Each point represents a simulation, while the dotted line represents the cost-effectiveness threshold (£20,000/QALY); combination is DFO–DFP. DFO desferrioxamine, DFP deferiprone, DFX deferasirox, QALY quality-adjusted life year
