Figure 1.
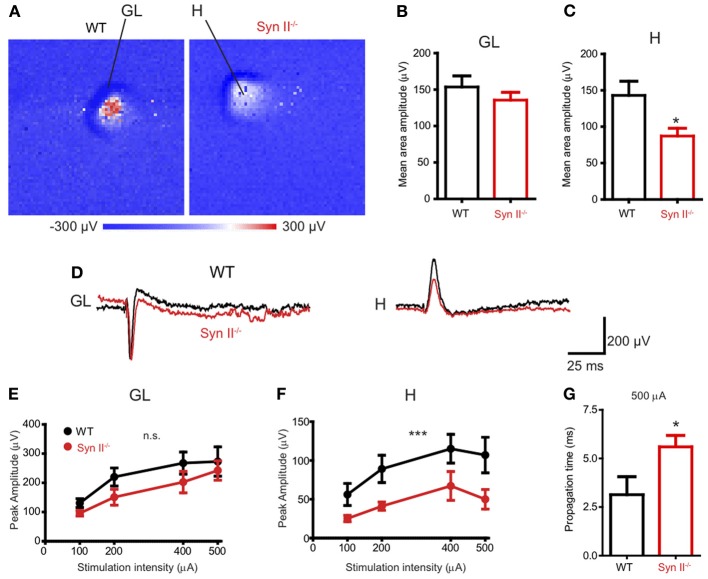
APS-MEA extracellular field recordings show decreased activity in the hilus upon stimulation of the perforant path. (A) Color-coded fPSP activity in the entire APS-MEA chip (each pixel represents one electrode) in WT and pre-symptomatic Syn II−/− slices with arrows showing the activated areas (GL, granule layer; H, hilus) upon perforant path stimulation. (B,C) Mean (±s.e.m.) amplitude of the entire response area from WT and pre-symptomatic Syn II−/− in the granule layer (B) and hilus (C); *p < 0.05, two-tailed unpaired Student's t-test. (D) Representative traces from one APS-MEA electrode from both genotypes located in the granule layer and hilus, respectively. (E,F) Stimulation-response curves representing the mean (±s.e.m.) peak amplitudes of three randomly selected electrodes from the granule layer (E) or hilus (F) at increasing stimulation intensities; ***p < 0.001, Two-Way ANOVA. (G) Mean (±s.e.m.) stimulus propagation time from GL to H at a stimulation intensity of 500 μA; *p < 0.05, two-tailed unpaired Student's t-test.

